Complaints by sector1
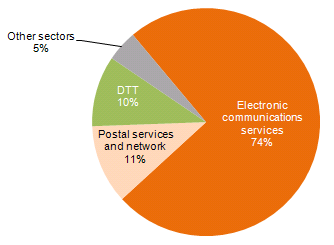
With regard to the sectors covered, in 2012 as in previous years, the majority of complaints focused on the electronic communications sector, comprising 60,103 records (increasing 2.2% over the previous year). The postal sector received the second largest number with 9,083 records, 21.2% fewer than in 2011, and third largest number in this period referred to DTT, with 8,132 records2.
Graph 35. Complaint records by sector, 2012

Source: ICP-ANACOM.
Notes
nt_title
1 Since an enquiry or request can refer to more than one provider, service or subject, for the purpose of the analysis of these points, the number of situations giving rise to complaint was counted in each request, which is designated in this report by the number of ''complaint records''. Using this indicator, a total of 80,883 records are considered as arising from the 57,220 requests received by ICP-ANACOM in 2012. As such, in 2012, each request comprised an average of 1.4 records.
2 In 2011, there were 651 complaints associated with DTT, increasing substantially in 2012 due to the switch-off of the analogue signal.
- 15.1.1. Electronic communications https://www.anacom.pt/render.jsp?categoryId=353075
- 15.1.2. Postal Network and Services https://www.anacom.pt/render.jsp?categoryId=353085
- 15.1.3. Digital terrestrial television (DTT) https://www.anacom.pt/render.jsp?categoryId=353086


