The results of the analysis to the Short Message Service provided to the public by the operators OPTIMUS?s, VODAFONE?s and TMN?s GSM mobile networks show that this service has a very good performance.
Of the 51,538 attempts to send test messages, over 99.9% were successful and more than 99.7% were delivered to the destination terminal, error-free and within the time frame defined by ETSI for this service (delivery time of up to 175 seconds).
Figure 1 ? Short Message Service Accessibility
Figure 2 ? Short Message Delivery Rate

Click here to see the full-size images
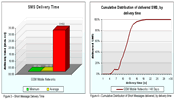
The Average Delivery Time of a short message was 12 seconds, being relevant the fact that more than 99% of the messages had a Delivery Time of less than 20 seconds.
Figure 3 ? Short Message Delivery Time
Figure 4 ? Cumulative Distribution of Short Messages delivered, by delivery time

Click here to see the full-size images
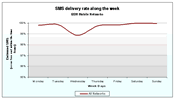
Service Accessibility, Delivery Rate and Average Delivery Time indicators do not show significant differences between weekdays and weekends. Nor are there significant differences when comparing the values of these indicators for each hour of the day. This is shown on graphics of figures 5, 6, 7, 8, 9 and 10.
The only relevant situation which had a repercussion on these indicators happened on 01/06/2005 (Wednesday), between 6h35 and 7h03. During this period operator Optimus?s Short Message Service broke down, causing a strong degradation of indicators Service Accessibility and Delivery Rate, as well as a strong increase on the messages? delivery time.
Figure 5 ? Variation in the Short Message Service Accessibility indicator along the week

Click here to see the full-size image
Figure 6 ? Variation in the Short Message Service Accessibility indicator along the day

Click here to see the full-size image
Figure 7 ? Variation in the Short Message Service Delivery Rate indicator along the week

Click here to see the full-size image
Figure 8 ? Variation in the Short Message Service Delivery Rate indicator along the day

Click here to see the full-size image
Figure 9 ? Variation in the Short Message Service Average Delivery Time indicator along the week

Click here to see the full-size image
Figure 10 ? Variation in the Short Message Service Average Delivery Time indicator along the day


