Main Results
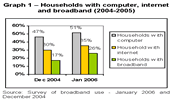
1. In January 2006, 26% of Portuguese household had broadband internet access, around 35.3% had internet and 51% had a computer.
The strong growth in broadband penetration among households should be highlighted - up 9% compared to the end of 2004. This can partly be put down to migration from narrowband to broadband.
Graph 1 ? Households with computer, internet and broadband (2004-2005)
(Click here to see the full-size image)
2. The main broadband access technology being used is ADSL (47.2%), followed by cable modem (46.6%).
It should also be noted that, according to available information, around 3% of broadband users use 3G mobile access.
| ADSL | 47.2% |
| Cable Modem | 46.6% |
| Others (FWA, etc.) | 2.0% |
| 3G wireless access card | 1.5% |
| 3G Mobile, connected to computer | 1.5% |
| Powerline Communications (PLC) | 1.3% |
Source: Survey of broadband use - January 2006
Powerline Communications (PLC) technology is used in 1.5% of households.
3. The biggest barrier to internet connection is ?lack of interest or need? (38.3%), while the second most given reason was ?lack of PC? (34%)
Only 8.6% cited the cost of the service as a barrier.
| Don?t need / not interested | 38.3% |
| Don?t have computer | 34.0% |
| Price is too high | 8.6% |
| Don?t have time | 3.5% |
| Have access in another place | 2.5% |
Source: Survey of broadband use - January 2006
It should be noted, however, that when it comes to the barriers to migration from narrowband to broadband (broadband now accounts for over 74% of internet access, rising from 56%), the reasons given are significantly different.
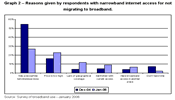
In fact when asked about the reason for not migrating to broadband, the proportion of users who respond ?Don?t need / not interested? falls from 55% to 27% while the proportion citing price rises from 16% to 23%. The proportion of users giving lack of geographical coverage as a reason also rises (4.3% to 11.7%).
Graph 2 ? Reasons given by respondents with narrowband internet access for not migrating to broadband.

(Click here to see the full-size image)
Finally, it can be seen that broadband users are in the most part young, urban and university educated, are students or professionals, and belong to A/B socio-economic groups. Therefore there could be socio-economic factors in play that may be influencing patterns of broadband possession.
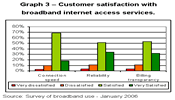
4. Looking at customer opinion, it can be seen that 8.8% of respondents answered that broadband internet access services had not met their expectations, whereas 88% replied that they were satisfied or very satisfied with the speed of access.
| Much worse than expected | 0.7% |
| Worse than expected | 8.1% |
| Same as expected | 69.2% |
| Better than expected | 19.2% |
| Much better than expected | 2.8% |
Source: Survey of broadband use - January 2006
When it comes to reliability 86% of broadband customers said they were either satisfied or very satisfied.
86% of customers also said they were either satisfied or very satisfied with billing transparency.
Of all customers, the customers of Netcabo were found to be the least satisfied when it came to connection speed, reliability and billing transparency.
Graph 3 ? Customer satisfaction with broadband internet access services
(Click here to see the full-size image)
5. The companies belonging to PT group provide broadband internet access services to around 70% of those surveyed, while Cabovisão came in with the second largest share of customers with 15%.
About 1 in 4 customers said that they might be changing operator within the next 12 months.
| Sapo ADSL | 37.8% |
| Netcabo | 32.2% |
| Cabovisão (cable) | 15.0% |
| Clix | 6.9% |
| Oni | 3.2% |
Source: Survey of broadband use - January 2006
| Will certainly switch | 8.0% |
| Has a lot of interest in switching | 7.1% |
| Has some interest in switching | 10.3% |
| Doesn?t have much interest in switching | 3.4% |
| No interest in switching | 71.1% |
Source: Survey of broadband use - January 2006
Note on methodology:
Survey of broadband use: January 2006
The target population defined for this survey was set as being individuals of both sexes, aged 18 or over and resident in Continental Portugal or the Autonomous Regions of Madeira and the Azores.
The size of the sample was set to ensure that the margin of error would not exceed 4% (assuming a degree of accuracy of 95%). The sample was structured by region and background.
For the selection of interviewees the quota method was used regarding sex, age, education and occupation.
In total 4,225 interviews were carried out, of which 1,099 were with broadband users.
The fieldwork was carried out by Tns Euroteste between 19 December 2005 and 23 January 2006.
Survey of Broadband Use: December 2004
The target population defined for this survey was set as being individuals of both sexes, aged 18 or over and resident in Continental Portugal or the Autonomous Regions of Madeira and the Azores.
The size of the sample was set to ensure that the margin of error would not exceed 4% (assuming a degree of accuracy of 95%). The sample was structured by region and background.
In total 4, 711 interviews were carried out, of which 794 were with broadband users.
The survey method used was telephone interview.
The survey work and the processing of data took place between 19 October 2004 and 13 December 2004 by INDEG/ISCTE.


