Fixed Telephone Service (FTS)https://www.anacom.pt/render.jsp?contentId=55129
Mobile Telephone Service (MTS)https://www.anacom.pt/render.jsp?contentId=55130
Methodologyhttps://www.anacom.pt/render.jsp?contentId=55131
1. According to the February 2006 electronic communications consumer survey, around 60% of Portuguese homes have a fixed-line telephone.
It should be noted that 5.7% of those who didn't subscribe to FTS expressed their intention to do so within one year.
| Possession of fixed telephone line |
60.0% |
Source: Electronic communications consumer survey Feb 2006
2. Those without a fixed-line telephone gave the following reasons: 'use of mobile phone' 61.2% and 'prefer not to pay line rental charge' 16.5%.
| Other | 7.3% |
| Too expensive | 4.2% |
| Don't need or don't need to communicate | 4.5% |
| It's cheaper to make calls by other means | 5.0% |
| Prefer not to pay monthly charge | 16.5% |
| Use mobile phone | 61.2% |
Source: Electronic communications consumer survey Feb 2006
The main advantage of the mobile phone service over fixed-line services is mobility according to 76.4% of respondents, and lack of monthly charge according to 11.9%.
| Mobility | 76.4% |
| No montly Charge | 11.9% |
| Priçes | 7.2% |
| Quality of communication | 1.5% |
| Level of customer support | 0.3% |
| No advantage | 0.1% |
| Other | 2.3% |
| Don't know / Didn't respond | 0.4% |
Source: Electronic communications consumer survey Feb 2006
3. Almost 1 in 5 of those who used a fixed-line phone said that they used more than one operator. Of these 31% used call-by-call selection, while 49.2% used pre-selection (There was a large of proportion of 'Don't know / Didn't respond'.)
| Use more than one fixed-line operator: |
19.1% | |
| Call-by-call selection | Pre-selection | |
|---|---|---|
| Currently use | 31.0% | 49.2% |
| Used in past but stopped | 23.2% | 12.1% |
| Aware of selection but never used | 15.8% | 12.0% |
| Unaware | 7.8% | 8.2% |
| Don't know / Didn't respond | 22.2% | 18.5% |
Source: Electronic communications consumer survey Feb 2006
Around 83% of those questioned were clients of PT. The operator with the second largest number of clients was Tele 2 (14.8%), followed by Cabovisão (11.5%).
| Client's network operator | Operator client uses to make calls | |
|---|---|---|
| PT | 83.4% | 68.7% |
| Tele2 | 14.8% | 14.8% |
| Cabovisão | 11.5% | 11.5% |
| Optimus Home | 2.6% | 2.6% |
| Novis | 2.4% | 2.4% |
| Clix | 2.0% | 2.0% |
| ONI | 1.9% | 1.9% |
| Others | 0.5% | 0.4% |
| Don't know / Didn't respond | 0.1% | 0.1% |
| Total | 119.1% | 104.4% |
Source: Electronic communications consumer survey Feb 2006
As far as the regulatory mechanisms in place for making it easier to switch operators are concerned, 62.4% of those surveyed said they were aware of fixed-line number portability.
| Aware of fixed-line number portability |
62.4% |
Source: electronic communications consumer survey Feb 2006
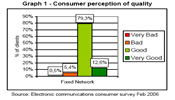
4. The majority of users said they considered the quality of the service to be good.
Graph 1 - Consumer perception of quality

(Click here to see the full-size image)
Mobile Telephone Service (MTS)
5. In February 2006, 84.5% of those surveyed had a mobile phone.
| Possession of mobile phone |
84.5% |
Source: electronic communications consumer survey Feb 2006
Of those who were mobile phone clients, 86% had one active card, 11.6% had two, while 2.4% had more than two cards.
Free contracts and pre-payment were the preferred option by 45.3% and 42.8% of clients, respectively.
| Number of cards | |
|---|---|
| 1 card | 86.0% |
| 2 cards | 11.6% |
| More than 2 cards | 2.4% |
| Type of contract | |
| Free | 45.3% |
| Pre-paid | 42.8% |
| Subscription | 9.1% |
Source: Electronic communications consumer survey Feb 2006
More than 20% of mobile phone clients acquired their phone less than six months ago. Around 17% acquired it more than six months ago but less than one year ago.
When they acquired their new phone 85% came with a card; however just under half of users (49.2%) continued to use only their existing card.
| Less than six months | 20.3% |
| 6 - 12 months | 17.0% |
| 1 - 2 years | 22.2% |
| More than 2 years | 40.4% |
| The new mobile phone came with a card | 85.3% |
|---|---|
| Continued using existing card | 49.2% |
| Used new card | 47.1% |
| Used both | 3.2% |
Source: Electronic communications consumer survey Feb 2006
6. Of the MTS clients surveyed, 16% said they had a 3G phone.
Of these, 63.4% used it send MMSs, 26.6% used it to make video calls and 8.8% to access the internet through their PC.
| Possess 3G mobile phone | 16.0% |
| Services Used: | |
|---|---|
| MMS | 63.9% |
| Download ring tones and images | 35.3% |
| Video calls | 26.6% |
| E-mail, Messenger or chat | 14.1% |
| Download games and online games | 11.7% |
| MMS Albums | 11.5% |
| Video services | 9.7% |
| Internet access through PC | 8.8% |
| Other type of internet access through mobile phone | 6.0% |
| None of the above | 22.7% |
| Don't know / Didn't respond | 0.5% |
Source: Electronic communications consumer survey Feb 2006
7. Of mobile service clients, 19.3% have already changed operator at least once. The two main reasons for switching were: most of the client?s contacts were clients of the new operator (34.6%) and dissatisfaction with prices (33.3%).
More than 66% of clients who have never changed their operator say they are satisfied with their existing service. 31.2% say that most of their contacts also use their operator.
As to the operators? share of clients, 51% of those surveyed said they were clients of TMN.
| Have already changed operator: | 19.30% |
|---|---|
| Most of my contacts are clients of new operator | 34.6% |
| Unhappy with prices | 33.3% |
| Unhappy with quality of service | 13.7% |
| Offer from new operator | 8.6% |
| Other | 20.6% |
| Never changed operator: | 80.7% |
| Satisfied with current operator | 66.2% |
| Most of my contacts are clients of current operator | 31.2% |
| Offers the best prices | 6.6% |
| Switching is too complicated / inertia | 3.2% |
| Decision of another person | 2.8% |
| More / better network coverage | 0.8% |
| Keep the same number | 0.4% |
| Other | 4.0% |
| Don't know / Didn't respond | 2.3% |
Source: Electronic communications consumer survey Feb 2006
Clients
TMN
52.3%
Vodafone
39.6%
Optimus
19.4%
Don't know / Didn't respond
0.3%
Total
111.6%
Source: Electronic communications consumer survey Feb 2006
8. 59.4% of MTS clients were aware of number portability.
| Aware of mobile portability |
59.4% |
| Have used mobile portability |
2.2% |
Source: Electronic communications consumer survey February 2006
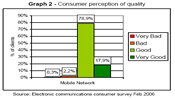
9. The majority of users considered the quality of service as good.
Graph 2 - Consumer perception of quality

(Click here to see the full-size image)
Source: Electronic communications consumer survey February 2006
Methodology
The population targeted by this survey are individuals of either sex, aged 15 or over, resident in Continental Portugal and the Autonomous regions of Madeira and The Azores. The size of the sample was set in order to obtain a 2.5% margin of error (assuming an accuracy rate of 95%). The sample was selected by sex, age and region, based on the latest population census: Census 2001. The survey was conducted by Marktest through 2,020 personal and direct interviews, carried out between 17 January 2006 and 22 February 2006.


