Summary
- In May 2015, the "Telephone and telefax services" sub-index1 remained unchanged versus the previous month and increased over May 2014 (3.44 percent). The monthly increase reported was less than the monthly increase in CPI (0.43 percent) but the year-on-year change in the sub-index was higher than CPI (0.95 percent).
On average, over the last 12 months, the increase reported in the prices of these services (1.11 percent) exceeded CPI (-0.11 percent), and exceeded the 2013 average (0.15 percent) and 2014 average (0.59 percent). However the increase was less than the average reported for the 2010/2014 period (1.17 percent). The reported increase in prices was the 11th highest among the 43 products/services considered (13th highest in April 2015 and 10th highest in May 2014).
- The year-on-year rate of change reported in Portugal is 3.47 percentage points above the variation reported in EU countries (3.81 percentage points in the previous month).
On average annual terms, the increase in prices reported in Portugal was 2.45 percentage points above the EU average (2.41 percentage points in April). Portugal was the EU country with the 4th highest increase in prices.
2. Evolution reported in CPI and "Telephone and telefax services" sub-index
The evolution reported in CPI and in the "Telephone and telefax services" sub-index in May 2015 is presented below with a description of the main trends of recent years.
2.1. Evolution reported in "Telephone and telefax services" sub-index - May 2015
In May 2015 and compared to the previous month, the "telephone and telefax services" sub-index remained unchanged (in the previous month it increased 0.08 percent and in May 2014 there was also no change). The rate of change was the 26th highest among the products/services considered (22nd highest in the previous month and 18th highest in May 2014). Over the same period, CPI rose by 0.43 percent.
The year-on-year change in the "telephone and telefax services" sub-index was reported at 3.44 percent, in line with the previous month. A year ago, this indicator rose 1.10 percent. The year-on-year rate of change in the "telephone and telefax services" sub-index was the 5th highest among the 43 groups of products/services that make up the CPI (5th in the previous month and 10th in May 2014).
In the month being reported, the average variation rate of the last 12 months was 1.11 percent, higher than as reported in the previous month (0.92 percent) and higher than as reported in May 2014 (0.98 percent). This value was the 11th highest among the 43 products/services considered (13th highest in April 2015 and 10th highest in May 2014). The average rate of growth in CPI over the same period was -0.11 percent, so that, in real terms, "telephone and telefax" prices increased by about 2.48 percent.
Furthermore, the average annual growth in May 2015 was higher than as reported in 2013 and 2014 and was lower, on average, than in the 2010/2014 period. In 2013 and on average in the period 2010-2014, the rates of change reported were lower than the rates of change reported in CPI, contrary to the present situation. The sector's relative position, when ranked in terms of price increases, was also significantly lower in these periods.
|
|
May 2015 |
2013 |
2014 |
Average 2014/2010 |
Accumulated 2014/2010 |
||
|
Year-on-year change |
Average change 12 months |
Monthly change |
|||||
|
Total |
0.95% |
-0.11% |
0.43% |
0.27% |
-0.28% |
1.59% |
6.52% |
|
Communications |
3.58% |
1.42% |
0.02% |
0.45% |
1.10% |
1.24% |
5.07% |
|
Ranking in descending order (12 divisions) |
2 |
4 |
8 |
7 |
3 |
5 |
5 |
|
Telephone and telefax services |
3.44% |
1.11% |
0.00% |
0.15% |
0.59% |
1.17% |
4.78% |
|
Ranking in descending order (43 groups) |
5 |
11 |
26 |
24 |
16 |
20 |
20 |
Source: INE (Statistics Portugal)
Unit: %, p.p.
Note 1: CPI average variation over last 12 months reported in April 2015.
Note 2: For 2013 and 2014, rate considered is the variation of annual averages in indices and sub-indices.
Nota 3: Accumulated value refers to the rate of variation of the annual average between 2011 and 2014 and 2014/2010 refers to the annualisation of this rate.
2.2. Historical evolution reported in “telephone and telefax services”
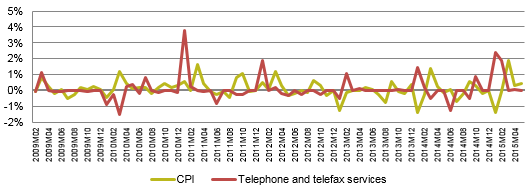
Usually, telecommunications prices rise at the beginning of each year as a result of providers implementing "price adjustments" between the months of January and February, and the variations in these periods are usually higher than the monthly change in CPI. In the remaining months, the situation is reversed, partly offsetting the real-terms increases seen early in the year.
Graphs 1 - Monthly rate of change in CPI and “telephone and telefax services” sub-index
Source: INE (Statistics Portugal)
Unit: %
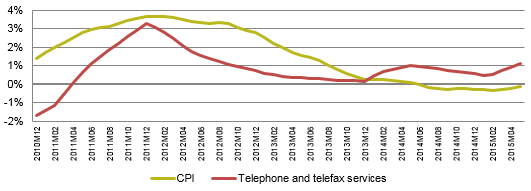
Historically, and in annual average terms, the average rate of change reported for "telephone and telefax services" was less than the change reported in CPI. However, since January 2014, this trend has reversed, with a differential in growth of 1.22 percentage points reported in May 2015, the biggest since at least 2010
Graphs 2 - Average rate of change over twelve months in CPI and “telephone and telefax services” sub-index
Source: INE (Statistics Portugal)
Unit: %
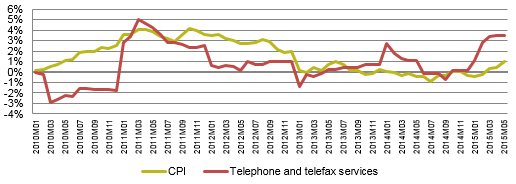
The rate of year-on-year change in "telephone and telefax services" was lower than the rate of year-on-year change in CPI over the entire period between January 2010 and July 2013 (except for the months of March to July 2011). However, since August 2013, the situation has reversed, with the rate of year-on-year change in this sub-index exceeding the rate of year-on-year change in CPI. The gap between the two indicators was at its widest in March 2015 (+3.05 percentage points), and was 2.48 percentage points in May 2015.
Graph 3 - Rate of year-on-year change in CPI and “telephone and telefax services” sub-index
Source: INE (Statistics Portugal)
Unit: %
3. Evolution reported in HICP and “telephone and telefax services” sub-index
The evolution reported in HICP and in the "Telephone and telefax services" sub-index in May 2015 is presented below.
3.1. Evolution reported in "Telephone and telefax services" sub-index - May 2015
In May 2015, the "telephone and telefax" sub-index in Portugal remained unchanged versus the previous month (in April, it increased 0.08 percent). Meanwhile, in the EU28 2, the sub-index increased by 0.08 percent (-0.09 percent in April). Portugal reported the seventh largest variation in prices among the 23 countries considered.
In year-on-year terms, there was an increase reported in prices in Portugal (3.44 percent), whereas prices in the EU declined (-0.03 percent). The difference between the two rates of variation was 3.47 percentage points (3.81 percentage points in April 2015 and 4.40 percentage points in May 2014).
On average annual terms, prices increased in Portugal by 2.45 percentage points above the average of the countries considered and was the country reporting the fourth largest increase in prices. Even so, the difference between the two rates is less than as reported in May 2014 (4.40 p.p.) and, on average terms, in 2013 (4.64 p.p.) and 2014 (2.53 p.p.), although greater than the difference reported in April 2015 (2.41 p.p.).
|
|
May 2015 |
2013 |
2014 |
Average 2014/2010 |
Accumulated 2014/2010 |
||
|
Year-on-year change |
Average change 12 months |
Monthly change |
|||||
|
EU - 28 |
-0.03% |
-1.34% |
0.08% |
-4.48% |
-1.94% |
-2.42% |
-9.32% |
|
Portugal |
3.44% |
1.11% |
0.00% |
0.15% |
0.58% |
1.17% |
4.78% |
|
PT EU-28 deviation |
3.47 p.p. |
2.45 p.p. |
-0.08 p.p. |
4.64 p.p. |
2.53 p.p. |
3.59 p.p. |
14.10 p.p. |
|
Ranking in descending order |
2 |
4 |
7 |
4 |
6 |
5 |
5 |
Source: EUROSTAT
Unit: %, p.p.
Note 1: Information not available for Ireland, Malta, the Netherlands, Sweden and United Kingdom. In 2010, information was also unavailable for Estonia, which is not considered in the "Average 2014/2010" and "Accumulated 2014/2010" rankings, so that 22 countries are considered in this Indicator.
3.2. Historical evolution reported in “telephone and telefax services” sub-index
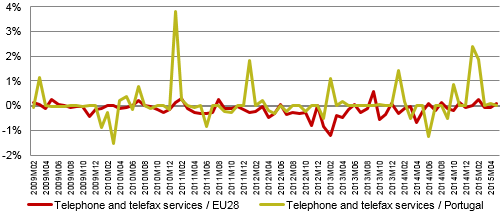
Usually, in the first months of each year, the variations reported in telecommunications prices in Portugal significantly outpace variations in prices reported in EU282; these difference are partially reverted over the rest of the year.
In 2011, the largest variation was reported in January (3.8 percent); in 2012, the largest variation was likewise reported in January (1.85 percent), whereas in 2013, the largest variation was reported in February (1.09 percent), reverting to January in 2014 (1.42 percent).
The monthly variation reported in January 2015 is the second largest of the period considered (2.39 percent).
Graphs 4 – Rate of monthly variation in prices of “telephone and telefax services”, Portugal vs. EU28 3
Source: INE (Statistics Portugal)
Unit: %
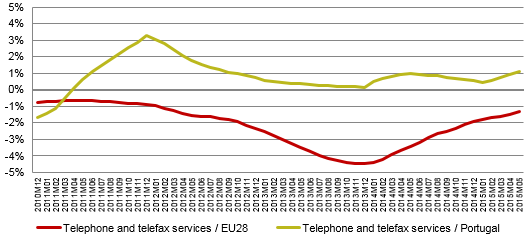
In annual average terms, the variation in the prices of "telephone and telefax services" in EU28 was negative over the analysed period, while in Portugal, variations have been positive since April 2011 and above the variations reported in EU282 since March 2011. After December 2011, the maximum difference was reported in January 2014 (4.92 percentage points), while the minimum difference between Portugal and the EU282 occurred in February 2015 (2.23 p.p.). The gap between Portugal and the EU282 narrowed significantly over the course of 2014.
Graph 5 – Rate of average variation over last 12 months in prices of “telephone and telefax services”, Portugal vs. EU28 4
Source: INE (Statistics Portugal)
Unit: %
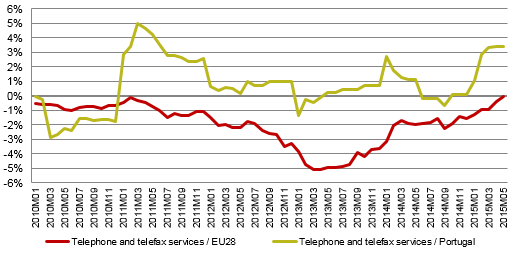
The year-on-year variation in Portugal has exceeded the EU282 average since January 2011.
The largest difference in year-on-year variations was reported in January 2014 (5.86 p.p.) and the smallest in August 2014 (1.4 p.p.). In May 2015, the difference was 3.47 4 p.p.
Graphs 6 – Rate of year-on-year variation in prices of “telephone and telefax services”, Portugal vs. EU28 5
Source: INE (Statistics Portugal)
Unit: %
1 The "Telephone and telefax services" sub-index of the Consumer Price Index (CPI) comprises voice, Internet and subscription TV (STV) services acquired on a stand-alone basis or as part of a bundle of services.
2 Information not available for Ireland, Malta, the Netherlands, Sweden and United Kingdom. Information for Estonia as from 2011.
3 Information not available for Ireland, Malta, the Netherlands, Sweden and United Kingdom. Information for Estonia as from 2011.
4 Information not available for Ireland, Malta, the Netherlands, Sweden and United Kingdom. Information for Estonia as from 2011.
5 Information not available for Ireland, Malta, the Netherlands, Sweden and United Kingdom. Information for Estonia as from 2011.


