According to the results of the Survey conducted by ANACOM, as at the end of 2014, the penetration rate of the fixed telephone service (FTS), the mobile telephone service (MTS) and the Internet access service (IAS) among Portugal's SMEs was between 89 and 94 percent.
Despite having one of the lowest levels of penetration (54.5 percent), the mobile Internet access service (MIAS) was the service that grew most between 2012 and 2014 (+5.9 percentage points), followed by the fixed Internet access service (FIAS) – which grew by +5.7 percentage points.
|
2007 |
2010 |
2012 |
2014 |
|
|
Fixed telephone service (FTS) |
95.8 |
90.3↓ |
92.3↑ |
93.5 |
|
Mobile telephone service (MTS) |
71.5 |
81.8↑ |
89.7↑ |
89.3 |
|
Internet access services(IAS) |
63.5 |
76.1↑ |
89.2↑ |
93.3↑ |
|
Fixed Internet access services (FIAS) |
: |
71.0 |
83.2↑ |
88.9↑ |
|
Mobile Internet access services (MIAS) |
: |
32.2 |
48.6↑ |
54.5↑ |
|
Subscription Television Service (STVS) |
4.5 |
13.1↑ |
10.9↓ |
15.7↑ |
Unit: %.
Source: ICP-ANACOM, Survey on the use of electronic communications services, SME, December 2007, 2010, 2012 and 2014
Base: All companies with fewer than 250 staff
Note 1: Estimates: (#) Unreliable estimate; (*) Acceptable estimate; (no symbol) Reliable estimate.1
Note 2: The 2007 survey did not separate Internet by type of access (fixed or mobile).
Note 3: An upward pointing arrow signals a statistically significant increase between t-1 and t, and a downward pointing arrow signals a statistically significant decline.2
According to Eurostat's annual survey “Information and Communication Technologies in enterprises”, which specifically covers companies with 10 or more employees3, penetration of the Internet access service among Portuguese companies is in line with the EU28 average. Mobile broadband access in Portugal is slightly higher than the EU28 average (66 percent versus 64 percent - with Portugal ranked 10th).
|
2010 |
2011 |
2012 |
2013 |
2014 |
|
|
EU28 (%) |
94 |
95 |
95 |
96 |
97 |
|
Portugal (%) |
94 |
95 |
95 |
96 |
97 |
|
Portugal ranking in EU28 |
18th |
17th |
18th |
17th |
16th |
|
Difference from EU28 average (p.p) |
0 |
0 |
0 |
0 |
0 |
Unit: %, p.p.
Source: Eurostat, European ICT survey: "Information and Communication Technologies in enterprises"
Base: Companies with 10 or more employees (not including Financial Sector)
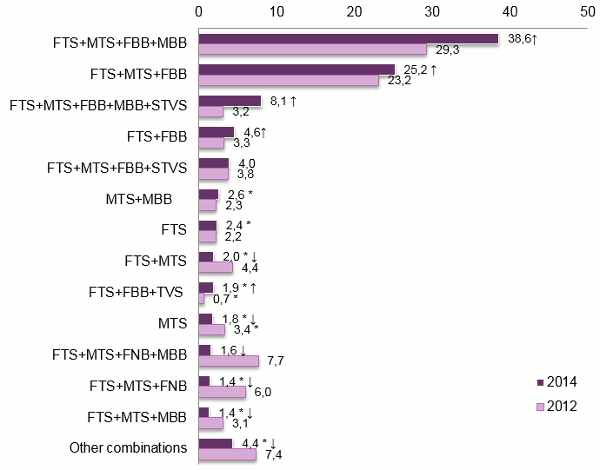
Around 53 percent of SMEs use 4 or 5 different electronic communication services (+7.8 percentage points versus 2012).
The combination of FTS+MTS+fixed broadband (FBB)+mobile broadband was the most popular combination of services (stand-alone or bundled) among SMEs, and the combination that saw most growth (+9.3 percentage point). The combination with the second highest rate of growth (+4.9 percentage points) comprised all five services (FTS+MTS+FBB+MBB+STVS).
Graph 1 - Combinations of electronic communication services
Unit: %.
Source: ICP-ANACOM, Survey on the use of electronic communications services, SME, December 2012 and 2014
Base: All companies with fewer than 250 staff
Note 1: Estimates: (#) Unreliable estimate; (*) Acceptable estimate; (no symbol) Reliable estimate.
Note 2: FTS - Fixed telephone service; MTS - Mobile telephone service; FBB – Fixed broadband; MBB – Mobile broadband; STVS – Subscription TV.
Note 3: An upward pointing arrow signals a statistically significant increase between t-1 and t, and a downward pointing arrow signals a statistically significant decline.
2.1.1. Use of leased lines and private networks
Leased lines and the private network management service saw little use by the companies surveyed (4.4 and 4.0 percent, respectively).
|
|
2014 |
|
Leased lines |
4.4 |
|
Private network management service / virtual private networks |
4.0 |
Unit: %.
Source: ICP-ANACOM, Survey on the use of electronic communications services, SME, December 2014
Base: All companies with fewer than 250 staff
Note: Estimates: (#) Unreliable estimate; (*) Acceptable estimate; (no symbol) Reliable estimate.
According to the survey's respondents, these services are used, in the most part, for storing, accessing, sharing and transmitting data and information resources, both in terms of internal company organisation (i.e. access to hardware/software/extranet/Internet/server/datacentres, internal company communications, billing/accounting, stock management, security/surveillance, external services/tele-working, relations between head office and other branches/offices/subsidiaries) and in terms of external relationships (i.e. supplier and customer payments).
Notes
nt_title
1The variation coefficient is considered as sampling error indicator, based on the variance of the “proportion” or “average” estimator (according to the case) of a simple random sample. The following classification is used: reliable estimate when variation coefficient of is less than 10 percent; acceptable estimate when variation coefficient is greater than or equal to 10 percent and less than 25 percent; unreliable estimate when variation coefficient is greater than or equal to 25 percent.
2 A statistical test was used of the difference between two proportions for large and independent samples with a confidence level of 95 percent.
3 The results of EUROSTAT's survey are not comparable with the survey conducted by ANACOM. The survey conducted by ANACOM includes micro-enterprises and excludes large companies, whereas EUROSTAT's survey excludes micro-enterprises and includes large companies.


