Table 7 shows QSI defined in the current Quality Convention and the corresponding level of quality achieved by CTT in 2013.
In 2013, QSI values reported by CTT reached the value established in the convention, except for standard mail not delivered within 15 working days (QSI4), which however stood above the Minimum value (vide Table 7 and Charts 1 to 10).
|
QUALITY OF SERVICE INDICATORS |
Quality Convention |
Quality of Service achieved |
|||
|
RI (%) |
Value |
||||
|
Minimum |
Target |
||||
|
QSI1 |
Transit time for standard mail (D+3) |
45.0 |
95.5% |
96.3% |
97.6% |
|
QSI2 |
Transit time for priority mail - Mainland (D+1) |
15.0 |
93.5% |
94.5% |
94.9% |
|
QSI3 |
Transit time for priority mail - MAM (D+2) |
4.0 |
84.0% |
87.0% |
93.3% |
|
QSI4 |
Standard mail not delivered within 15 working days (per one thousand letters) |
5.0 |
2.3‰ |
1.4‰ |
1.5% |
|
QSI5 |
Priority mail not delivered within 10 working days (per one thousand letters) |
3.0 |
2.5‰ |
1.5‰ |
1.3% |
|
QSI6 |
Transit time for newspapers and periodicals (D+3) |
11.0 |
95.5% |
96.3% |
97.5% |
|
QSI7 |
Transit time for intra-community cross-border mail (D+3) |
3.5 |
85.0% |
88.0% |
(i) 93.1% |
|
QSI8 |
Transit time for intra-community cross-border mail (D+5) |
3.5 |
95.0% |
97.0% |
(i) 98.9% |
|
QSI9 |
Transit time for standard parcels (D+3) |
5.0 |
90.5% |
92.0% |
95.5% |
|
QSI10 |
Waiting time at post establishments (% of cases up to 10 minutes) |
5.0 |
75.0% |
85.0% |
90.4% |
|
OI |
OVERALL QUALITY OF SERVICE INDICATOR (b) |
N/A |
N/A |
N/A |
228 |
Source: (a) CTT. (b) ICP-ANACOM calculation. (c) values yet to be audited.
Notes: (i) Annual value corresponding to the weighted average of the value for the 4th quarter of 2012 and the value of the first three quarters of 2013.
D+X, means delivery up to X working day(s) after deposit of items at a mail reception point.
RI - Relative importance
N/A - Not applicable
Chart 1 - Transit time for standard mail (D+3)
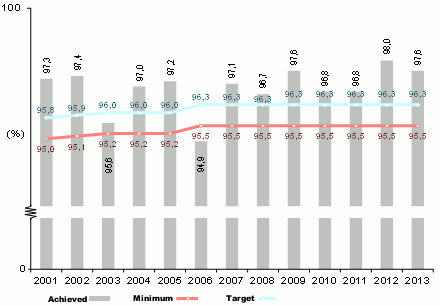
Source: CTT. Indicator exists since 1995. Values achieved as from 2001 are given.
Chart 2 Transit time for priority mail - Mainland (D+1)
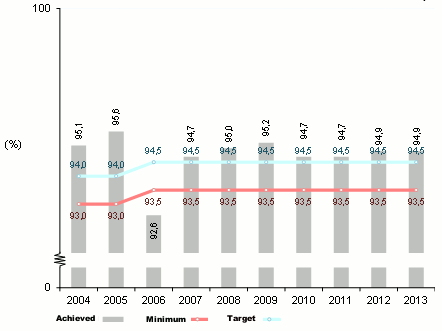
Source: CTT. Indicator exists since 1994.
Chart 3 - Transit time for priority mail - MAM (D+2)
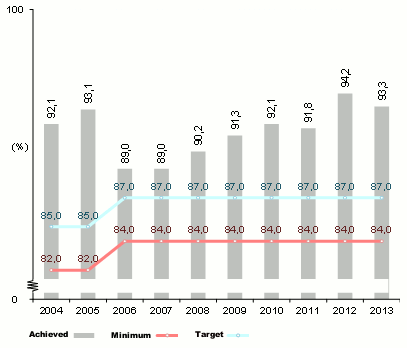
Source: CTT. Indicator exists since 1994.
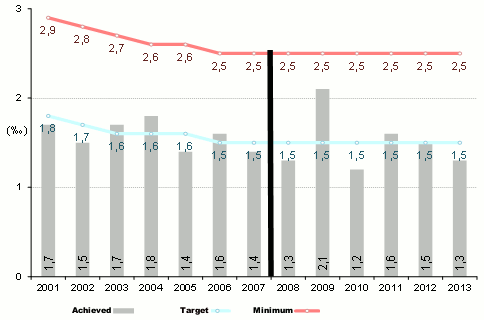
Chart 4 - Standard mail not delivered within 15 working days*
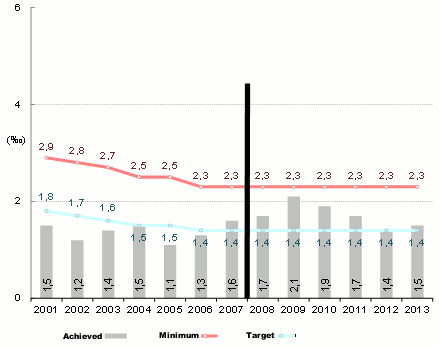
Source: CTT. Indicator exists since 1995, however values achieved as from 2001 are presented.
*The lower the value, the better the quality. In 2007 the calculation methodology was changed, thus its comparison with previous values must be properly addressed.
Chart 5 - Priority mail not delivered within 10 working days*
Source: CTT. Indicator exists since 1995. Values achieved as from 2001 are given.
*The lower the value, the better the quality. In 2007 the calculation methodology was changed, thus its comparison with previous values must be properly addressed.
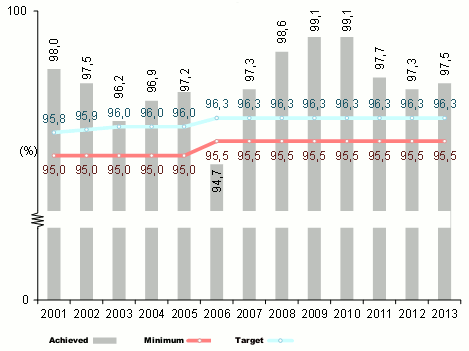
Chart 6 - Transit time for newspapers and periodicals (D+3)
Source: CTT. Indicator exists since 2001.
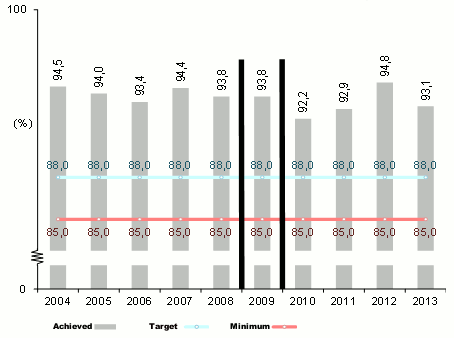
Chart 7 - Transit time for intra-community cross-border mail (D+3)
Source: CTT. Indicator exists since 1994.
*The calculation methodology was changed in 2008 and 2009, thus its value as from 2009 is not directly comparable to previous years.
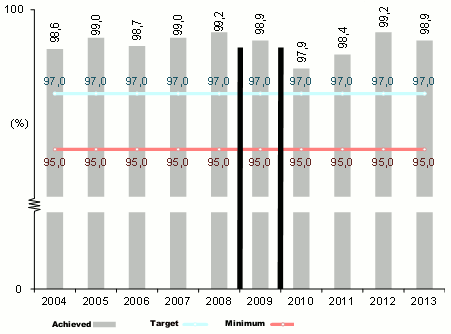
Chart 8 - Transit time for intra-community cross-border mail (D+5)
Source: CTT. Indicator exists since 1994.
*The calculation methodology was changed in 2008 and 2009, thus its value as from 2009 is not directly comparable to previous years.
Chart 9 - Transit time for standard parcels (D+3)
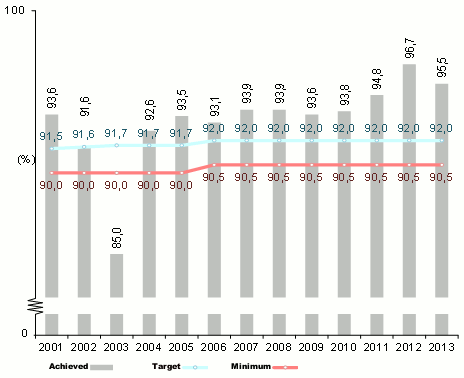
Source: CTT. Indicator exists since 2001.
Chart 10 - Waiting time at post establishments (% of cases up to 10 minutes)
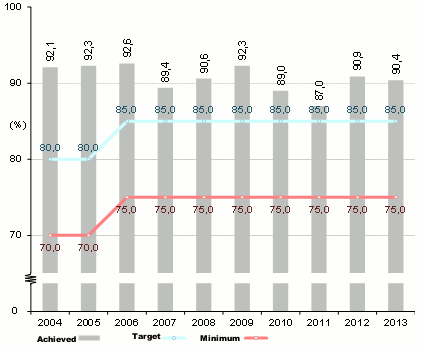
Source: CTT. Indicator exists since 2001.
It was found that for QSI3, QSI7, QSI8 and QSI10, levels of quality achieved by CTT always exceeded the Target value.
For QSI1, QSI2, QSI6 and QSI9, values achieved exceeded the respective Target value, except for 2003 and 2006.
Since 2007, the value achieved for QSI4 does not exceed the defined Target value, matching or exceeding however the Minimum value. In 2003, 2004, 2006, 2009 and 2011, QSI5 did not reach the defined Target value, although the Minimum value was always exceeded.
The value of the overall quality of service indicator (OI), which depends on values of remaining QSI taken separately, has exceeded 100, except for 2003 and 2006 (Chart 11).
Chart 11 - OI evolution
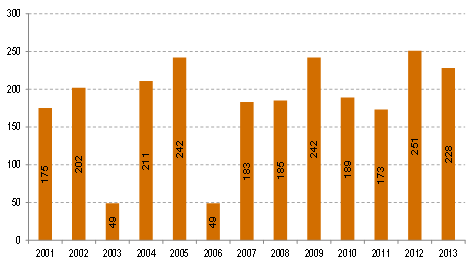
Note: Given that the OI value is a result of QSI individual values, due account must be taken when comparing OI evolution, bearing in mind changes introduced at the level of QSI defined for each year and of the respective calculation methodology.
At European level, the Target value defined in Portugal for national priority mail transit time is the 8th most demanding, in a total of 29 countries (Chart 12). At the level of results effectively achieved, in 2012, Portugal was surpassed only by Malta, Austria, Luxembourg, Slovenia, Slovakia and Sweden.
It was found also that in most countries, Target values have remained constant, except for France, Malta and the Czech Republic, which have increased the respective Target values, and for Latvia and Finland, which have decreased their Target values.
Chart 12 - Target values (2009, 2010 and 2012) and achieved value (2012) for domestic priority mail
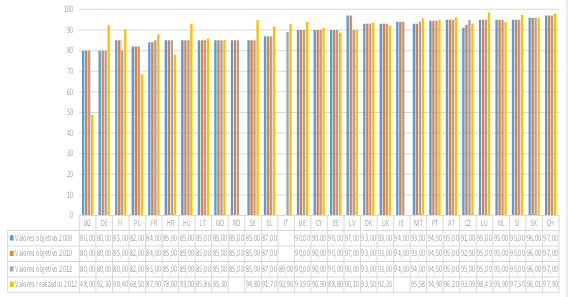
Source: ERGP reports on quality of service (available at "ERGP Documents http://ec.europa.eu/internal_market/ergp/documentation/documents_en.htm").
Notes: the standard of service is D+1. In Portugal, values concerns QSI2, and thus only the priority letter delivery service to and from the Mainland, excluding mail to and from the Autonomous Regions, is taken into consideration.
As regards non-priority mail transit time, as can be seen from Chart 13, the value achieved by Portugal is one of the highest among countries where this service is also provided and where regulatory targets have been defined.
Chart 13 - Target and achieved values for domestic non-priority mail in 2012
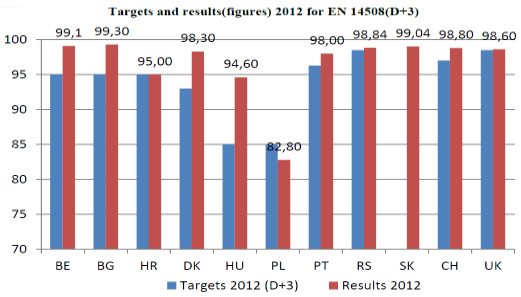
Source: “ERGP Report 2013 on the quality of service and end-user satisfaction”, of 2013.
Note: Portugal, QSI1. According to the referred report, the average for values achieved in the 11 countries where Target regulatory values for non-priority mail transit time have been set out is 96.58%: “In general, the results for D+3 were good in 2012, with an average of 96.58%.”
Taking into account that levels of quality currently defined represent appropriate quality targets, bearing in mind the required balance between the provision of a quality universal service and costs associated to its provision, it is deemed that current Target and Minimum levels should be maintained.
As far as the new QSI11 is concerned, on transit time for registered mail (D+1), as this is an indicator with a standard of service similar to priority mail, delivery on D+1, although this standard of service may be extended in the case of mail between the Mainland and the Autonomous Regions, and inter-island mail, according to transport limitations1, in principle performance targets similar to those practised by CTT for national priority mail should be defined. According to the most recent annual data, for 2011, 2012 and 2013, CTT delivered annually between 92% and 93% of priority mail, at national level, in D+12.
However, taking into account that operational procedures for registered mail differ from those associated to priority mail, namely involving more demanding operational tasks and manual handling, which priority mail does not require, ICP - ANACOM believes that lower performance targets than values achieved by CTT for national priority mail should be defined. In this context, it is deemed that Minimum and Target values should be 89% and 91%, respectively.
In the light of the above, Target and Minimum values intended to be defined are as follows:
|
QUALITY OF SERVICE INDICATORS |
Quality Convention |
||||||
|
2015 |
2016-2017 |
||||||
|
RI (%) |
Value |
IR (%) |
Value |
||||
|
Minimum |
Target |
Minimum |
Target |
||||
|
QSI1 |
Transit time for standard mail (D+3) |
45.0 |
95.5% |
96.3% |
32.0 |
95.5% |
96.3% |
|
QSI2 |
Transit time for priority mail - Mainland (D+1) |
15.0 |
93.5% |
94.5% |
6.0 |
93.5% |
94.5% |
|
QSI3 |
Transit time for priority mail - MAM (D+2) |
4.0 |
84.0% |
87.0% |
3.0 |
84.0% |
87.0% |
|
QSI4 |
Standard mail not delivered within 15 working days (per one thousand letters) |
5.0 |
2.3‰ |
1.4‰ |
3.0 |
2.3‰ |
1.4‰ |
|
QSI5 |
Priority mail not delivered within 10 working days (per one thousand letters) |
3.0 |
2.5‰ |
1.5‰ |
3.0 |
2.5‰ |
1.5‰ |
|
QSI6 |
Transit time for newspapers and periodicals (D+3) |
11.0 |
95.5% |
96.3% |
10.0 |
95.5% |
96.3% |
|
QSI7 |
Transit time for intra-community cross-border mail (D+3) |
3.5 |
85.0% |
88.0% |
2.5 |
85.0% |
88.0% |
|
QSI8 |
Transit time for intra-community cross-border mail (D+5) |
3.5 |
95.0% |
97.0% |
2.5 |
95.0% |
97.0% |
|
QSI9 |
Transit time for standard parcels (D+3) |
5.0 |
90.5% |
92.0% |
3.0 |
90.5% |
92.0% |
|
QSI10 |
Waiting time at post establishments (% of cases up to 10 minutes) |
5.0 |
75.0% |
85.0% |
5.0 |
75.0% |
85.0% |
|
QSI11 |
Transit time for registered mail (D+1) |
N.A. |
N.A. |
N.A. |
30.0 |
89.0% |
91.0% |
|
OI |
Overall Quality of Service Indicator |
N.A. |
90.0% |
100.0% |
N.A. |
90.0% |
100.0% |
Note: Not applicable - N.A.
1 Source: CTT’s website, consulted on 16.10.2014.
2 Source: CTT data reported under paragraph 3 of article 10 of the 2008 Quality Convention.


