Trend in ported numbers1
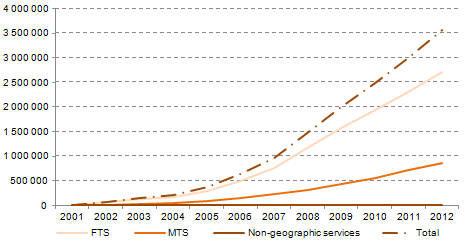
Since the introduction of number portability in 2001 (data until 31 December 2012), 3,571,907 telephone numbers have been subject to portability (2,705,281 geographic numbers, 864,061 mobile numbers and 2,565 other non-geographic numbers, including 57 numbers in the 30 numbering range - Nomadic Voice over Internet Protocol (VoIP)).
The following graph shows the evolution reported in the volume of ported geographic and mobile numbers - since 2004, as a result of increased competition between fixed telephone services, the growth rate has been more pronounced.
Graph 22. Evolution in accumulated volume of telephone
numbers that have been subject to portability

Source: ICP-ANACOM.
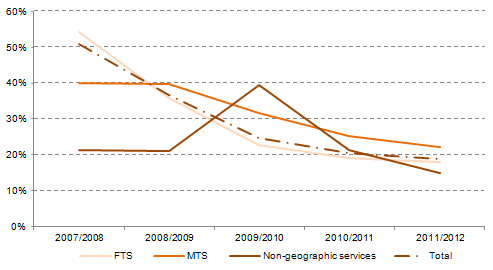
In line with 2011, use of portability in the mobile telephone service remained relatively low. However, between 2011 to 2012 growth in mobile number portability (22.2%) exceeded growth reported in the portability of geographic numbers (17.83%), although, in absolute terms, portability in the mobile service remains limited. Meanwhile, growth in the portability of non-geographic numbers (including nomadic numbers) was reported at 14.8%. These three growth rates are below the annual rates of previous years since 2007 and countering the trend seen previously. These can be seen in the following chart.
Graph 23. Evolution in the growth rate of the accumulated number of
numbers which have been subject to portability

Source: ICP-ANACOM.
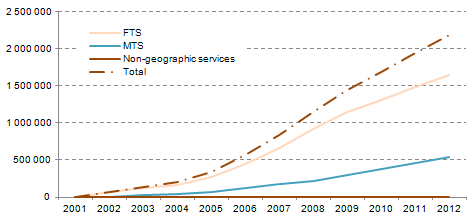
The actual evolution in ported numbers is shown (numbers that were ported at a given time) in accordance with the data shown in the records of the database of the reference entity. The values are lower than those shown in the previous graph, since portability may be used multiple times for the same number where a single customer successively switches providers multiple times, possibly including a return to their original provider.
As such, and as illustrated in the graph below, on 31 December 2012 there were 2,183,882 ported telephone numbers, including 1,644,097 geographic numbers (FTS), 537,713 mobile numbers (MTS) and 2072 other non-geographic numbers (SNG), including 49 ported numbers in the 30 numbering range (nomadic VoIP).
Graph 24. Evolution in the volume of actual ported numbers in the database

Source: ICP-ANACOM.
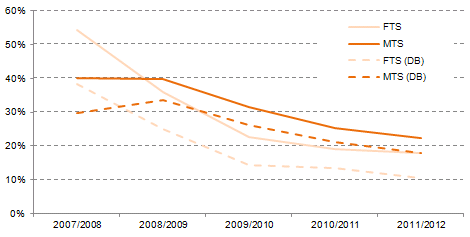
Again it is noted that the growth rates were below the annual rates - this is more pronounced in terms of geographic numbers, as can be seen in the chart below. This may be explained by fixed telephone service subscribers returning to their original operators.
Graph 25. Comparative evolution in the growth rate reported in the volume
of ported numbers and volume of actual ported numbers in databases

Source: ICP-ANACOM.
1 The data presented here does not reflect the changes resulting from the merger between PT Prime and PTC. This information will be reviewed once this data is made available to ICP-ANACOM.


