ICP-ANACOM's interventions in previous years (especially regarding quality of service and provision of adequate information in a simple manner) and persistent investment in own infrastructure (transport and access network) by alternative operators meant that use of the RDAO remained very important in 2012.
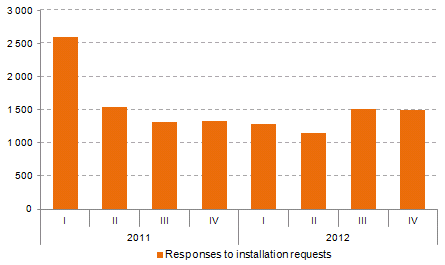
This use can be confirmed by the evolution in the number of responses provided by PTC to requests for installation of cables in its ducts, as presented in the following graph. Indeed, the fact that RDAO use remains at high levels, even while significant parts of the national territory are already covered by alternative infrastructure (including cable distribution networks and networks supported over optical fibre), indicates that alternative operators have continued to expand their networks.
Graph 11. Number of responses to installation requests

Source: ICP-ANACOM based on data from PTC.
Data on the number of responses to feasibility requests and the number of responses to requests for information on underground infrastructures is no longer essential for monitoring the extent of RDAO use, given that, since 2011, alternative operators have been able to consult this information on the RDAO Extranet in geographic areas where alternative operators use this offer more intensely (especially Greater Lisbon and Greater Porto).
As such, in 2012, particular attention was given to verification and confirmation that the information contained in the RDAO Extranet (referring to the existence of inspection chambers, duct routes, access extensions and duct occupation levels) was up-to-date and current with the situation on the ground. A series of inspections were performed to check this situation, and it was found that, in some situations, the accuracy of the information provided in the RDAO Extranet needed improving.
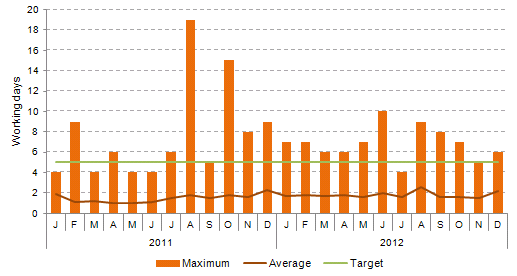
ICP-ANACOM continued to monitor the evolution in the quality levels of wholesale services provided by PTC pursuant to this wholesale offer. For reasons already explained, note is made of the indicators used to measure response times to requests for installation. There was stabilization in the average time taken to respond to these requests and the maximum response recorded monthly no longer exceeded 10 days (as was the case in 2011). However, in 2012, as in 2011, maximum response times were reported in some months that exceeded the targets set in the RDAO (5 working days). However, this does not necessarily imply generalised non-compliance - since these indicators of quality of service are set to 100% of cases, so that their values refer to the worst occurring case1. For this reason it is important to note that the average response time for 100% of the cases remained close to 2 working days over the entire year of 2012; i.e., on average, the response time was substantially lower than the target defined in the offer.
Graph 12. Time limits for responding to requests for installation

Source: ICP-ANACOM based on data from PTC.
1 That is, in an extreme scenario, there may be only one situation in which the response time exceeded 5 working days.


