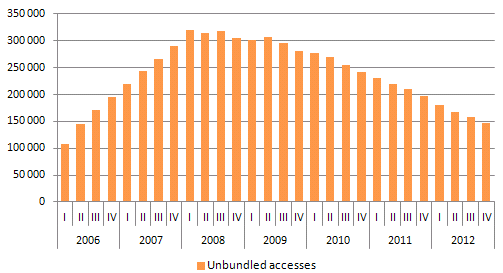
The number of unbundled loops covered by the RUO, which provides alternative operators with physical access to end-customer premises through copper pairs controlled by PTC, has been declining since 2009. In 2012, the decline continued (by about 25%), falling to around 147 thousand by the end of the year.
Graph 4. Evolution in the number of unbundled loops

Source: ICP-ANACOM based on data from PTC.
A continued decline was to be expected, given that the main beneficiaries of the RUO have been discontinuing retail offers supported over this wholesale offer and have instead been investing in their own optical fibre infrastructure, exclusively providing their new customers with offers supported over their own network infrastructure. Consequently, in Portugal, with one of the highest NGA coverage rates in the EU, the penetration of unbundled loops compared to the total number of active accesses controlled by the incumbent operator was below the European average (calculated excluding Portugal) in January 2013. This was not the case in previous years.
Graph 5. Percentage of unbundled loops compared to total number of active accesses controlled by the incumbent operator

Source: ICP-ANACOM based on EC data, January 2012.
Likewise, the reduced investment by alternative operators in the RUO has resulted in a stabilisation in the number of PTC exchange with co-located operators. At the end of 2012 there were operators co-located in the same 239 PTC exchanges.
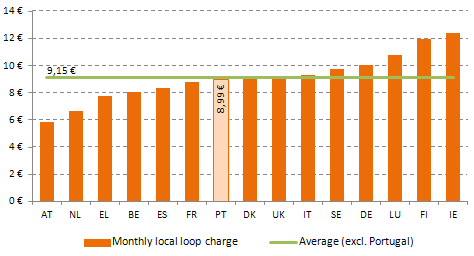
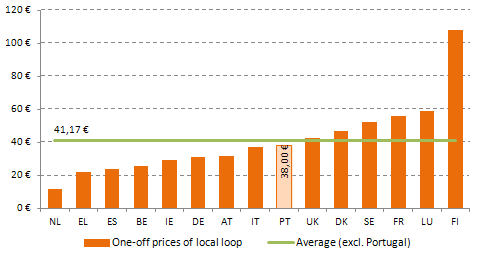
In 2012, there were no interventions as regards RUO pricing. Nevertheless, analysis and monitoring of prices in Portugal was continued. These prices compare favourably with those practised in other European countries - monthly charges and one-off prices for local loop practiced in Portugal both remain in line with good practice at EU level (EU15) as illustrated in the following charts.
Graph 6. Local loop monthly charge (full access) - EU15 comparison

Source: ICP-ANACOM based on data from Cullen International (December 2012).
Graph 7. Local loop one-off prices (full access) - EU15 comparison

Source: ICP-ANACOM based on data from Cullen International (December 2012).


