Graph 1 shows the results of the CLSU for 2007-2009, as initially presented by PTC on 28.11.2011 (initial values), as recalculated by PTC on 19.02.2013 following the preliminary report of the initial audit by SVP and already incorporating the impact of ICP-ANACOM determination of 12.10.2012 (intermediate values), and as recalculated and presented by PTC on 28.06.2013 following ICP ANACOM decision of 20.06.2013 (final values).
Graph 1 - CLSU estimates for the years 2007 to 2009

Source: PTC. Amounts in millions of euros.
As can be seen from the graph above, CLSU estimates for the years 2007 to 2009 decreased by 19 percent from the initial values to the final values now determined. This decrease stems from the identification of issues during the audit process and from ICP-ANACOM determinations - on 12.10.2012, the determination on the implementation of the concept of "unusually high access costs" and on 20.06.2013, especially as regards the treatment of non-recurring installation costs (and respective revenues) in calculating the CLSU associated with non-profitable customers (one-off costs). In absolute terms this decrease corresponds to a reduction of 12.8 million euros for the three-year period in question, with an average annual value of CLSU for the relevant years of 22.3 million euros.
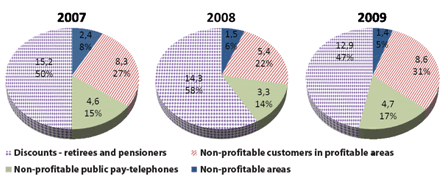
The following graph shows the development, in terms of presented net costs, for the final values obtained in each of the CLSU models, specifically as regards non-profitable areas, non-profitable customers in profitable areas, public pay-telephones and retirees and pensioners1, showing the weight of each of these components in the CLSU total before indirect benefits.
Graph 2 - Net costs before indirect benefits by component (2007-2009)
Source: PTC and ICP-ANACOM calculations. Absolute values expressed in millions of euros.
It is found that the component which takes greater weight in total net costs before indirect benefits is that of discounts provided to retirees and pensioners - near or even above 50 percent - followed by the component related to non-profitable customers in profitable areas - above 20 per cent.
The non-profitable public pay-telephone component is the third largest in terms of weight in the CLSU total with about 15 percent. Finally, it is seen that the component with least weight is that associated with non-profitable areas, with an expression in the range of 5 to 8 percent.
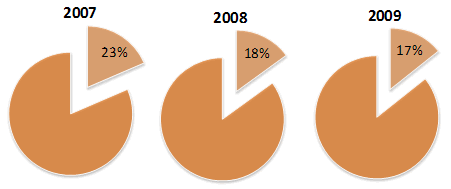
Meanwhile the value of indirect benefits in 2008/2009 is less relevant in terms of the reduction in the total value of costs (i.e., in the determination of CLSU), compared to 2007. Nevertheless, and as can be seen in the graph and table below, the weight of indirect benefits in the decline in the value of CLSU before indirect benefits remains significant - over 16 percent.
Graph 3 - Weight of indirect benefits in total CLSU before indirect benefits
Source: PTC and ICP-ANACOM calculations.
|
|
2007 |
2008 |
2009 |
|
Indirect benefits |
6.9 |
4.3 |
4.6 |
Source: PTC. Amounts in millions of euros.
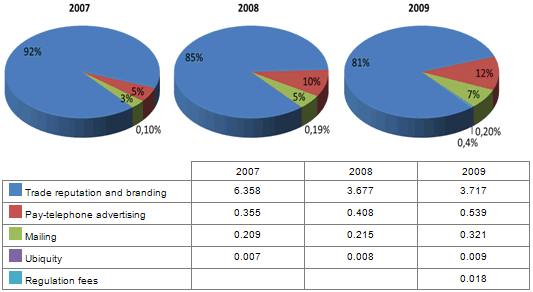
The total value of indirect benefits saw a significant decrease from 2007 to 2008 (-38 per cent). This reduction results from the significant decrease in the value associated with the benefit of trade reputation and stronger branding (-42 percent from 2007 to 2008).
Trade reputation and stronger branding is, in any case, the most expressive indirect benefit in terms of total benefits, with a weight of over 80 per cent in each of the years in question. In absolute terms, the values reported for this benefit during the period being reported fluctuate; this fluctuation results from variations in the valuation given to the "Portugal Telecom" brand in the studies of the European Brand Institute (EBI), as considered for the purposes of determining this indirect benefit.
Public pay-telephone advertising was the second largest component in terms of weight in the total value of indirect benefits and has also reported growth in absolute and relative terms over the period, as can be seen in the graph below.
"Mailing" is the third most significant benefit over the entire period with a maximum weight in total benefits ranging from 3 to 7 percent. The absolute value of this benefit has seen an increase over the period.
The indirect benefit of "ubiquity" is observed as having little importance in terms of total indirect benefits - registering a maximum weight in the period of 0.2 percent - with an upward trend reported in the 2007-2009 period. And the indirect benefit associated with "regulation fees", applicable only in 2009 during the years in question, had a weight that year of 0.4 per cent in the total value of indirect benefits, which underlines its lack of expression.
Graph 4 - Final values of indirect benefits by type of benefit (2007-2009)
Source: PTC and ICP-ANACOM calculations. Amounts in millions of euros.
It is also important to note other data extracted from the CLSU calculation model: the CLSU calculation model covers 1853 areas, with 45 areas considered as non-profitable in the years in question (2.4 percent of the total), comprising 0.7 to 0.8 percent of total customers, as identified in the following table. This number of areas already reflects the application of plausibility criteria and is limited to areas that are non-profitable in all years considered.
Start of confidential information [SCI]
|
Exchange code |
Name |
|
|
|
|
|
|
|
|
|
|
|
|
|
|
|
|
|
|
|
|
|
|
|
|
|
|
|
|
|
|
|
|
|
|
|
|
|
|
|
|
|
|
|
|
|
|
|
|
|
|
|
|
|
|
|
|
|
|
|
|
|
|
|
|
|
|
|
|
|
End of confidential information [ECI]
Source: PTC
Other relevant data derived from the three remaining components - non-profitable customers in profitable areas, non-profitable public pay-telephones and retirees and pensioners - is shown in the graphs below, in particular:
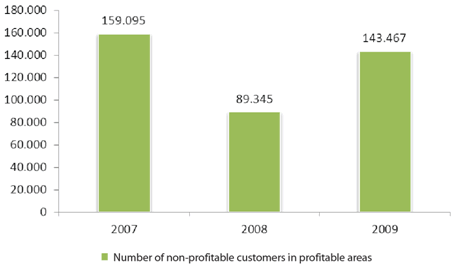
- the percentage of non-profitable customers in profitable areas represented according to the year in question, ranging between 4 and 7 percent of the total, confirming the expectation that they represent only a small portion of the total;
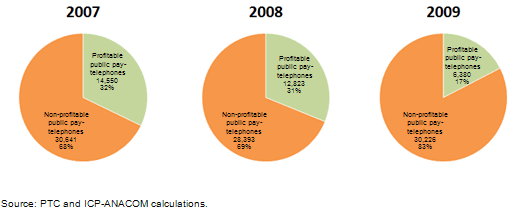
- the percentage of non-profitable public pay-telephones, rising over the period to over 80 percent in 2009;
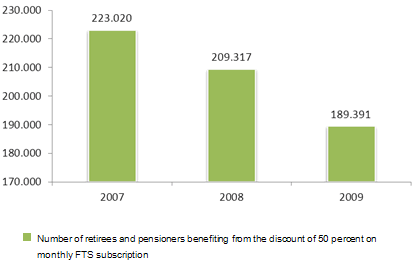
- the number of beneficiary retirees and pensioners with specific offers, declining significantly between 2007 and 2009, decreasing 15 per cent between these two years.
Graph 5 - Number of non-profitable customers in profitable areas
Source: PTC.
Graph 6 - Number of profitable and non-profitable public pay-telephones in all areas
Source: PTC and ICP-ANACOM calculations.
Graph 7 - Number of retirees and pensioners benefiting from the discount of 50 percent on monthly FTS subscription (also includes WLRO beneficiaries)
Source: PTC.
As regards the evolution of values over the 2007-2009 period, it is noted that the CLSU were obtained using, as a starting point, the data inputs presented by PTC in the respective SCA of each of the years in question, which in turn was also subject to auditing and which dictated in part the need to re-submit the values of the CLSU. Accordingly, the variations in the CLSU values also result from variations observed in the values of costs and revenues contained in the SCA, arising, in particular and in the first case, from changes in net assets, with direct impact on amortisation costs.
In particular, it is noted that between 2007 and 2008 and between 2008 and 2009, there has been a reduction in total avoidable costs and total lost revenues (considering all areas and all customers). Nevertheless, between 2007 and 2008, this decrease exceeded the decline in revenues. This explains the significant reduction in the number of non-profitable customers over this period, as well as the net cost associated with these customers. Between 2008 and 2009, even though total avoidable costs and total lost revenues both continued to decline, the situation is reversed, so that the reduction in costs was smaller than the drop in revenues - this led to a significant increase in the number of non-profitable customers in profitable areas and in the respective CLSU.
It is also noted that the significant variation in the number of customers also results from the fact that, given the referred fluctuations in revenues and costs, there is a fringe of customers on the threshold of profitability. As such, even small changes, but of different proportions, in total costs and revenues, have a substantial impact on the total number of non-profitable customers and on the CLSU of these customers.
It is also shown that, in line with the overall results for total avoidable costs and total lost revenues (considering all areas and all customers), the costs and total specific revenues associated with public pay-telephone have also declined over the period. In this case, the results for 2009 show a sharp reduction, compared to 2008, in total lost revenues; this reduction was not matched by a significant reduction in total avoidable costs, which together dictate an increase in the number of non-profitable public pay-telephones in 2009, albeit it at a level lower than in 2007.
1 Note is made to the difference between avoidable costs and lost revenues.


