According to statistical information published by the ITU (ITU, 2010) in October 2010, the number of internet users worldwide doubled over the preceding five years, exceeding two billion users as at the end of 2010.
Also according to ITU statistics, the number of subscribers to 3G services, worldwide, has increased from 72 million in 2005 to 940 million in 2010; these services, which in 2007 were present in only 95 countries, are now available in 143 countries.
The ITU considers that the current trend points towards increasing use of data applications (mobile) rather than voice. This trend is reflected in the growing number of text messages sent, tripling in the last three years to reach 6.1 trillion 1 in 2010, or put another way, 200 thousand messages sent every second.
With broadband content growing rapidly, along with Internet based applications, there is growing demand for higher-speed broadband connections. This, associated with the sharp increase in new broadband users will lead to an exponential increase in the volume of information on the Internet and of traffic.
The volume of information on the Internet and traffic volumes have been growing at an exponential rate (due largely to the proliferation of video, audio and image sharing, the increasing number of online game players and, in parallel, the mass take-up of social networks), while bandwidth remains limited and susceptible to a "flood" of data corresponding to multiple exabytes 2.
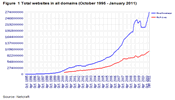
This increased volume of information/traffic is visible in the evolution reported in the number of websites between 2000 and 2010 (see Figure 1) and in the evolution of traffic. At the end of 2000, there were around 8.2 million active websites in the world, whereas by the first quarter of 2010 there were around 84 million, representing an increase over the period of 924%.
Figure 1 - Total websites in all domains (October 1995 - January 2011)
The increase in traffic was mainly due to demand for services such as video over the Internet (downloadable video 3 or streaming video 4), online games / virtual reality, IPTV 5, applications which allow content sharing between users (peer-to-peer) 6, portable devices with Internet access and cameras (e.g. 3G phones), e-learning, home security and smart homes, access control, electronic commerce and social networks.
Some examples which illustrate the increase in traffic include:
a) E-mail messages, with 12 billion messages sent in 2000 and 6.1 trillion 7 messages sent in 2009;
b) Google, which in 2000 indexed a billion of pages and around one trillion 8 pages in 2008.
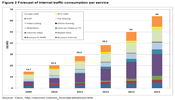
According to global IP traffic forecasts released by Cisco (2008), residential video consumption will be responsible for most of the traffic growth seen between 2007 and 2012.
Cisco also sees (see Figure 2) global IP traffic growth of 64 exabytes per month in 2014, with around three quarters of this traffic having residential use. Of the 64 exabytes of traffic generated per month in 2014, around half will be from Internet video applications.
Figure 2 - Forecast of Internet traffic consumption per service
Besides mobile equipment used for mobile communications services, it is expected that in 2010, there were 14 billion network connected devices (in 2000 there were 100 million). Considering the large number of products/objects (environmental sensors, identification chips, applications in food products, post, etc.) 9 where it is possible to place an RFID chip 10, a substantial increase in connections is expected, as well as in data. In coming years, more and more devices will communicate with each other and with humans, creating what is termed the "Internet of Things" (ITU, 2005).
With the possibility that, in the near future, more objects will have real-time monitoring capability and will be connected to networks, and with the widespread adoption of services such as video over Internet, online/virtual reality, IPTV, TV3D 11/Home Theatre, "Super Hi-Vision" 12, content sharing applications (peer-to-peer), 3G/4G mobile devices, "cloud computing" 13, e-learning, inactivity sensors, online medical consultation, home security, smart homes, access controls, electronic commerce and social networking, traffic values will continue to increase dramatically over current values.
If, when the Internet began, connections with speeds of 56 kbps were sufficient, today new applications and services currently require bandwidths in tens of Mbps, with a clear trend of increased need (at least 100 Mbps in the short term). As such, new access networks with greater capacity (bandwidth) will be required to support the traffic generated and to enable each citizen to take better advantage of existing and future technologies and services.
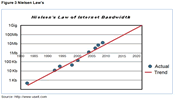
In 1998, Jakob Nielsen theorized that, for a sophisticated consumer, Internet access bandwidth would have compound growth of 57 times over ten years. Figure 3 shows that this forecast has been adjusted to reality, and has become what is now known (by analogy with "Moore's Law" 14 on the development of integrated circuits) as "Nielsen's Law", suggesting an increase in bandwidth used by a sophisticated user of about 50% per annum.
Figure 3 - Nielsen Law's
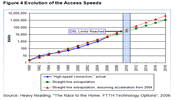
Also in relation to the evolution in access speeds, in 2006 Heavy Reading made some predictions that are close to the current reality. In Figure 4, the green line extrapolates the historical growth rate with a growth factor of 2.29 per annum, while the red line provides for an acceleration of growth from 2004 to a factor of three per year. It appears that the forecast for 2010 is perfectly in line with the "typical" offers currently being marketed by operators, and that according to this forecast, by 2020, bandwidth per customer will exceed 1 Gbps.
Figure 4 - Evolution of the Access Speeds
Although the forecast according to "Nielsen's Law" is more conservative than Heavy Reading’s forecast (pointing to speeds of around 10 Mbps for 2010 while Heavy Reading suggests values of around 50 Mbps) 15, both are clear in the evolution of evolution of speeds over the coming years and suggest a sustained level of growth over the next years.
Given this increased traffic and new and innovative services, a better quality broadband connection becomes a necessity (for example, with a lower contention ratio 16 and latency 17) providing users with a good experience and allowing them to enjoy all the benefits that these services enable.
Moreover, until recently, the traffic was mostly in the downstream direction (from the network to the user), with upstream speed being of little consequence (having volumes substantially lower than in the downstream direction). However, recently new usage patterns have been reported, in which more and more users send content to each other (e.g. photographs or video) and place their content online to share with others, or for backup, with a tendency for information to be accessible on the Internet from any device/place and at any time, i.e. "it is in the cloud". As such, this new trend is leading to rising demand for higher upload speeds, with a trend towards a narrowing in download/upload speed ratios which also calls for next generation access networks which support this trend.
With traffic growing much faster than revenues and faster than the number of customers, operators are faced with having to provide increasingly higher speeds without receiving an effective return on the investments made to support these speeds. To offset this disparity, operators need new services that consumers are willing to pay up for and, for their part, new networks with capacity to support such services (3Play, QuadPlay) while enabling significant reduction in the "cost per bit".
It is precisely these new networks - NGN / NGA - which enable these services to be offered without the limitations of previous networks (copper), particularly in terms of bandwidth (in both directions).
1 6.1 thousand billion.
2 According to the prefixes adopted by the International System (IS), exabyte is a unit of information equal to 1,000,000,000,000,000,000 bytes or 1018 bytes.
3 Video that can be downloaded onto any computer with internet access (saving it, for example, on the hard disk).
4 Streaming video is a sequence of images transmitted over the Internet in compressed form and displayed on the end-user's monitor. With video streaming, the Internet user does not need to wait for the download of the file to finish before watching the video.
5 Internet Protocol TV.
6 Peer-to-peer traffic represented about 55% of the total volume of IP traffic in southern European countries in 2008/2009 (ipoque, 2009).
7 6.1 thousand billion.
8 One thousand billion.
9 In Portugal, this technology has been widely used in Via Verde.
10 RFID stands for "Radio-Frequency IDentification". It is an automatic identification technology using radio signals, retrieving and storing data remotely using devices called RFID tags.
11 3D television sets are currently sold around the world (the 2010 football World Cup transmitted in this technology).
12 This system, which has been tested jointly by the BBC and NHK in 2008, entails an information density of thirty-two times higher than HDTV, with thirty-three million pixels.
13 Cloud computing refers to the use of applications residing on remote servers, accessed over the Internet rather than being installed on the user's computer. As such, the functions of management and maintenance, backup procedures or access control, shall be supported by the service provider.
14 Moore's Law tells us that the processing capacity of chips doubles every 18 months and size decreases at the same rate.
15 In Portugal there are already several offers of 100 Mbps and even 200 Mbps for residential customers.
16 The contention ratio is the value which limits the sharing of the speed of a determined access by various customers and is defined by a parameter (1:k). The speed can be reduced by this effect, in extreme cases by up to 1/K of the contracted speed.
17 Refers to the time elapsing after a send operation is executed until the data begins to arrive at its destination.


