Target Populationhttps://www.anacom.pt/render.jsp?contentId=55129
Sample definition and selectionhttps://www.anacom.pt/render.jsp?contentId=55130
Quality control of resultshttps://www.anacom.pt/render.jsp?contentId=55131
Precision of resultshttps://www.anacom.pt/render.jsp?contentId=55132
Weightinghttps://www.anacom.pt/render.jsp?contentId=55133
Technical architecture, operating mode and component detailhttps://www.anacom.pt/render.jsp?contentId=55134
Target Population
The target population is made up of Mainland Portugal households with at least one individual using the Internet from home, having one of the following Operators, and corresponding packages, as their ISP (Internet Service Provider):
|
Target ISPs |
Technology |
Commercial offering under analysis |
|
|
Maximum download speed |
Maximum upload speed |
||
|
Cabovisão |
Cable |
10Mbps |
512Kb |
|
Clix |
ADSL |
24Mbps |
1Mbps |
|
Sapo |
ADSL |
4Mbps |
1Mbps |
|
Vodafone |
ADSL |
12Mbps |
1Mbps |
|
Zon |
Cable |
10Mbps |
512Kb |
The offerings analysed are the Operator’s most representative Offering.
Sample definition and selection
The sample was chosen by probability sampling. {0>One of the main decision-makers in choosing the Internet service was selected in each household. The study excluded all households where at least one of the members worked for entities or departments related to: ICP-ANACOM, telecommunications or market studies. Recruiting was done by phone.
A stratified random sample was designed by region (table 6) and, within each region, by NUTIII, having been selected from address listings included in the regions considered for this study. The stratification by region was distributed in proportion to the number of customer households of the operators and to the offerings under study in each region.
One of the main decision-makers in choosing the Internet service was selected in each household. The study excluded all households where at least one of the members worked for entities or departments related to: ICP-ANACOM, telecommunications or market studies. Recruiting was done by phone.
In each household, only one access was selected in the test period (seven days), which was reserved for carrying out the tests (see 0). After quality control, 258 measurements were considered valid, and they had the following distribution:
|
ISP |
No. of measurements |
Region |
No. of measurements |
|
Cabovisão |
52 |
Algarve and Alentejo |
25 |
|
Clix |
52 |
Centre |
57 |
|
Sapo |
51 |
Lisbon |
102 |
|
Vodafone |
53 |
Greater Porto |
39 |
|
Zon |
50 |
North |
35 |
It should be noted that the distribution per region had the sole purpose of guaranteeing the geographical dispersal of measurements rather than to achieve statistical representativeness.
The regions presented correspond to an aggregation of the NUTIII regions:
- Algarve to Alentejo: Alentejo Central; Alentejo Litoral; Alto Alentejo; Baixo Alentejo; Lezíria do Tejo; Algarve.
- Centre: Baixo Mondego; Baixo Vouga; Beira Interior Norte; Beira Interior Sul; Cova da Beira; Dão-Lafões; Médio Tejo; Oeste; Pinhal Interior Norte; Pinhal Interior Sul; Pinhal Litoral; Serra da Estrela.
- Lisbon: Greater Lisbon; Setúbal Peninsula.
- Greater Porto
- North: Alto Trás-os-Montes; Ave; Cávado; Douro; Entre Douro e Vouga; Minho-Lima; Tâmega.
A total of 61 measurements (9 per week day and 8 per weekend) were carried out in each household. At least 3 tests were carried out in each indicator, operator and time schedule (one test for the FCCN server and two tests for the international ISP servers); therefore, 3 tests X 61 periods X 52 households, giving an average of 9,516 measurements per indicator and operator.
Tests were carried out on weekdays and at weekends between 5 December 2009 and 17 March 20101, according to the following schedule:
|
Order |
Week Days |
Weekends |
|
From 8h00 to 10h00 |
X |
X |
|
From 10h00 to 12h00 |
X |
X |
|
From 12h00 to 16h00 |
X |
X |
|
From 16h00 to 18h00 |
X |
X |
|
From 18h00 to 20h00 |
X |
X |
|
From 20h00 to 21h00 |
X |
X |
|
From 21h00 to 23h00 |
X |
X |
|
From 23h00 to 1h00 |
X |
X |
|
From 1h00 to 4h00 |
X |
X |
Quality control of results
The work being carried out was subject to a rigorous quality control throughout all stages of the study. In the first stage, during the data collection period, collected data was regularly monitored in order to detect any anomalous situations. Some examples include the identification of maximum speeds faster than those declared by participants, therefore outside the sample under study, or very low speeds justified by reasons related to the test panel member. At the same time all test panel members were asked to send their bill, not only where there were some doubts, but in order to confirm the commercial offering under analysis during the test period.
After the measurements, Outliers were identified for later analysis. Extreme values explained by server downtime or by faults attributed to test panel members were eliminated. The remaining values, even if extreme, were kept since they could not be traced to any other sources apart from the operator´s service.
Precision of results
Result precision obtained for an average, with a 95% confidence level, for one of the collected indicators (download speed in this case) is described in the table below:
|
|
Absolute Precision |
Relative Precision |
|||||||||
|
Cabovisão |
Clix |
Sapo |
Vodafone |
Zon |
Cabovisão |
Clix |
Sapo |
Vodafone |
Zon |
||
|
Server |
USA |
42.18 |
34.53 |
45.44 |
20.30 |
55.74 |
2.3% |
1.8% |
2.2% |
1.0% |
2.6% |
|
UK |
68.69 |
64.95 |
57.78 |
59.74 |
92.58 |
1.7% |
2.0% |
2.4% |
1.5% |
2.3% |
|
|
National |
102.98 |
164.45 |
59.17 |
186.08 |
120.04 |
1.4% |
2.6% |
2.2% |
2.0% |
1.5% |
|
It should be noted that for calculating the error margin a formula corresponding to a simple random sample was used, since the weight of the crossing variables was unknown.
For a more detailed reading of the error margins please see Annex 6.1.
Weighting
Each element of the sample was given a weight that made it possible to establish a statistical inference for the entire target population. The method used to determine these weights, or extrapolation factors, was the adjustment by margins, which adjusts the results obtained to known totals of support variables, in order to correct possible distortions registered in the sample.
First of all each test panel member was weighted according to the region and the operator they belong to, based on the information supplied by the ISP on the weight of each region in the total amount of customers of the offering under analysis.
An adjustment was carried out later by replacing the initial weight factors of the sample individuals with the final adjusted weight factors, using a distance factor subject to the following restrictions: for the Week day and Period variables, the weighted observations of these variables’ modes in the sample after the adjustment keep the same weight within each operator and server.
The determination of the weight factors is thus an optimization issue, whose purpose is to reduce the distance between the initial weights and the final adjusted weights, subject to the conditions that guarantee that the extrapolated support variables with final adjusted weights are equal to the known population totals.
Technical architecture, operating mode and component detail
The IxChariot tool was used to assess the quality of the fixed broadband access service.
Aiming to test and evaluate ISP quality of service, the IxChariot made it possible to measure the performance of the Internet access service in order to identify characteristics describing the user’s experience.
IxChariot generates and analyses traffic by creating with precision data flows of client/server transactions, providing real traffic flows between network endpoints, for the most relevant transport protocols (TCP, UDP, RTP, IPX).
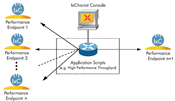
Figure 6 - IxChariot system components
Figure 6 represents the components of the IxChariot system. Tests are carried out from one Endpoint to another Endpoint, with test scheduling and execution orders being sent by the ''IxChariot Console''. Endpoint n+1 Performance corresponds to the software agents installed on the national and international servers.
For this service the solution was to place a ''Performance Endpoint'' on the national and international target servers allocated for this evaluation. The remaining Endpoints are hardware agents that were installed in the households of the test panel members with the broadband connections to be evaluated. The ''IxChariot Console'' managed and scheduled the tests between the several ''Performance Endpoints'' distributed on the networks and the “Performance Endpoint” installed on the national and international servers (Performance Endpoint n+1), whose description was already included in the mobile tests details (common target servers).
The ''IxChariot Console'' scheduled, collected and stored the data obtained during the tests carried out, together with the ''Aptixia Test Conductor'' application.
As a result one obtains detailed measurements of the end user experience, as well as measurements that indicate the network's performance.
Application traffic on a network has a dynamic character which translates into a statistical variety of performance measurements undergoing constant change. Through the distribution of network endpoints (IxChariot endpoints), IxChariot makes it possible to have an image of the network at each moment, thus making it possible to identify possible network performance problems.
In the particular case of file transfers through the Bittorrent (Peer-to-Peer tests), a test topology similar to an FTP transfer was implemented, i.e., only 2 peers were included in each transfer (one was installed on a test customer/residence, and the other on a target server). As with the remaining ones, the tests were carried out through the IxChariot (Bittorrent emulation). There is no centralized broadband control of the tool, rather, each peer is responsible for trying to maximize its download bandwidth by means of a variant of a known mechanism called ''tit-for-tat''2. This mechanism is simply based on a reciprocity effect between peers when all collaborate in file sharing. Meaning, if one peer who starts a file download shows interest in cooperating, allowing other peers to upload that file simultaneously, it will automatically benefit from a higher download speed. When the download process is started for the first time, the peers are optimistic by default and they all rely on the cooperation amongst them. After the first seconds of file exchanges, if this initial optimism is not sustained by some peers (available for upload), then it triggers the mechanism, named choking, of the upload speed of some peers, which means the download for others. In the specific case of the tests carried out only 2 peers were used who were configured in the most optimistic mode in order to maximize the bandwidth in both directions. Regarding the publication of results, the tests relating to download were published, by analogy with the FTP transfer.
-
System architecture
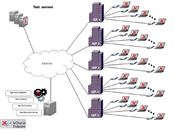
The measurement units (hardware agents) were installed in the test panel members' households by sending from the hardware agents. The agents will be detected by the Discovery Server solution once correctly installed.
Figure 7 - Architecture of the proposed system
Each software agent was controlled remotely through the ''IxChariot Console'', at the bottom left of Figure 7, which is installed on an independent machine, carrying out the detailed scheduling together with the ''Aptixia Test Conductor'', through work orders in the time, operator, technology, type of application, and other domains.
-
Agent identification
The solution offered identified each customer through the assigned IP. The possible change of IP by means of automatic refreshing of the ISP or other situation such as rebooting the machine was catered for by a dynamic DNS service.
A single code was also used at the time of installation in order to check the records each time the application was executed.
1 Measurements were interrupted between 23 December 2009 and 3 January 2010 since this was considered to be an atypical period.
2 Nice Guys Finish Firsthttp://en.wikipedia.org/wiki/Nice_Guys_Finish_First.


