The following maximum porting prices are in force since 12.03.2008.
|
Porting per individual number |
4,01 |
|
Blocks of 1 to 9 numbers |
4,01 |
|
Blocks of 10 to 99 numbers |
1,47 |
|
Blocks of ≥100 numbers |
0,73 |
Figures in Euro (VAT excluded).
It is recalled that these prices were set taking into account the estimates produced by ICP-ANACOM based on the 2006 AAS and to estimates presented by PTC (with common costs corrected, with an acceptable maximum of 10% of total direct and joint costs). It was assumed that they represented the maximum and minimum limits of an interval containing the effective costs for 2008.
PTC proposes for RIO 2010 a significant increase of prices of number portability service, namely:
|
|
Maximum prices proposed by PTC for 2010 |
Deviation of PTC’s proposal from prices in force |
|
Porting per individual number |
6,30 |
+57% |
|
Blocks of 1 to 9 numbers |
6,30 |
+57% |
|
Blocks of 10 to 99 numbers |
2,30 |
+56% |
|
Blocks of ≥100 numbers |
1,15 |
+58% |
Figures in Euro (VAT excluded).
Source: PTC’s letter of 2009.12.30.
PTC declares that it based its proposal on an average individual number porting price of 4.30€, range prices being calculated based on actual values of portings undertaken by PTC for other fixed networks between March and December 2009.
It is thus important to take into account the evolution of costs reported in the AAS, the estimates presented by PTC and those made by ICP-ANACOM for the portability service.
|
|
2007 |
2008 |
ICP-ANACOM 2009 estimates (3) |
ICP-ANACOM 2010 estimates (3) |
||||
|
2007 AAS |
PTC 2007 estimates |
ICP-ANACOM 2007 estimates (1) |
2008 AAS |
PTC 2008 estimates |
ICP-ANACOM 2008 estimates (2) |
|||
|
Direct Costs |
|
|
|
|
|
|
|
|
|
Joint Costs |
|
|
|
|
|
|
|
|
|
Direct + Joint Costs |
|
|
|
|
|
|
|
|
|
Common Costs |
|
|
|
|
|
|
|
|
|
Total Cost |
|
|
|
|
|
|
|
|
[ECI] Figures in Euros.
(1) Estimates by ICP-ANACOM based on the 2006 AAS and used in determination of 2008.05.16
(2)Estimates by ICP-ANACOM based on the 2007 AAS.
(3) Estimates by ICP-ANACOM based on the 2008 AAS, assuming a 5%annual reduction of direct and joint unit costs and that common costs represent a maximum of10% of total direct and joint unit costs.
As can be seen from the table above, ICP - ANACOM’s estimates for 2008 based on the 2006 AAS are very close to 2008 AAS values (merely 1.4% higher), and the value used to calculate prices for 2008 [SCI] [ECI], corresponding to a midpoint of PTC and ICP - ANACOM’s estimates, is 17% lower than the value in the 2008 AAS.
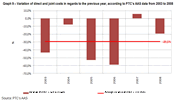
According to PTC’s AAS, direct and joint costs concerning number portability have recorded considerable variations, as shown on the following graph concerning the 2003-2008 period.
Graph 9 – Variation of direct and joint costs in regards to the previous year, according to PTC’s AAS data from 2003 to 2008
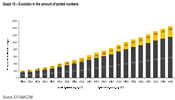
It is also important to observe the evolution in the amount of ported numbers, stressing out the fact that they’ve had a considerable increase over the last few years. The following graph shows the evolution registered on this matter:
Graph 10 – Evolution in the amount of ported numbers
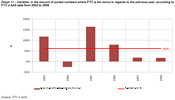
In the particular case of the amount of ported numbers where PTC is the donor, there has been a decrease in the amount’s growth rate since 2005, as shown on the following graph.
Graph 11 – Variation in the amount of ported numbers where PTC is the donor in regards to the previous year, according to PTC’s AAS data from 2003 to 2008
According to AAS data, it can be observed that there is no direct relation between the amount of portings where PTC is the donor and unit costs. In 2007, for example, unit costs kept practically constant although the amount of portings increased by around 18%, whereas in 2008 the number of portings undertaken increased by around 17%, that is, a rate very close to the one recorded in the previous year, in spite of a reduction of direct and joint unit costs by around 19%, as shown earlier.
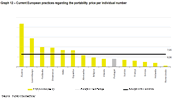
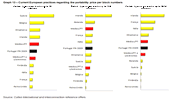
It is necessary also to observe this matter’s situation at the EU level. According to the information collected in February 2009, these are the values charged for porting an individual number:
Graph 12 – Current European practices regarding the portability price per individual number
It can thus be observed that the RIO 2009 price for portability per individual number compares favourably with the EU average (with and without extremes), Portugal ranking 6th.
As regards current European practices on the portability price per block of numbers up to 10, 100 and 1000 numbers, the situation is as follows:
Graph 13 – Current European practices regarding the portability price per block numbers
It can thus be concluded that portability prices of block numbers rank very close to the EU average excluding Portugal (taking into account EU countries for which data on prices applied is available), for portability of blocks up to 10 numbers and up to 1000 numbers, and lag behind as regards portability of blocks up to 100 numbers. In the absence of specific cost accounting data for the porting of ranges of numbers, this approximation is considered to be correct to establish porting prices.
As referred in the determination on amendments to RIO 2007, it is acknowledged that the estimated cost cannot be compared to the price of porting of an individual number, but to the average price charged (which includes individual numbers and porting of ranges), which justifies an adjustment of the average price to the average cost.
Thus, and in line with the process followed in previous RIO, figures for the porting of blocks of numbers (from 10 to 99 numbers and for more than 100 numbers) are established based on the EU average (excluding Portugal), as indicated above, and the price for the porting of numbers from 1 to 9 numbers (including the porting of an individual number) is established taking into account the referred cost estimate for 2010 referred in table 29 [SCI] [ECI], prices associated to the porting of blocks of numbers (from 10 to 99 numbers and for more than 100 numbers), and the weight of PTC’s ported numbers as donor operator, for 2008 and 2009, for each level 1. It results that the price for the porting of numbers from 1 to 9 numbers (including the porting of an individual number) should be 4.59€, which is deemed to allow a reasonable margin to address a reasonable level of common costs and to compare favourably with current European practises.
The following table summarizes maximum porting activation prices per number to prevail as from 15 April 2010.
|
|
Current price |
Maximum RIO 2010 price (to prevail as from15.04.2010) |
Percentage change |
|
Porting per individual number |
4,01 |
4,59 |
+15% |
|
Blocks of 1 to 9 numbers |
4,01 |
4,59 |
+15% |
|
Blocks of 10 to 99 numbers |
1,47 |
1,59 |
+8% |
|
Blocks of ≥100 numbers |
0,73 |
0,74 |
+1% |
Figures in Euro.
Maximum prices thus defined represent in average (considering the 2008-09 weights) an overall variation of 13.8%.
1 ICP - ANACOM decided to use an average value for 2008 and 2009, and not just an average for the most recent year (2009), as this year showed a very sharp change of distribution of ported numbers, where PTC is the donor entity between porting per individual number, blocs of 1 to 9 numbers, 10 to 99 numbers and equal to or higher than 100 numbers. Note that, taking into account historical information, the situation in 2009 is an unusual one, and for this reason, given its impact on the definition of prices of the number portability service, it was considered appropriate to adopt the average for both years.

