As regards the traffic volume expected for 2010, PTC’s estimates assume a decrease by around 4% of the global interconnection traffic volume relatively to that routed in 2009. The following table shows PTC’s estimates for time-base interconnection traffic volumes for 2010, as well the 2009 results and the corresponding variations, broken down by level (local, simple tandem and double tandem).
|
|
2009 |
PTC 2010 Estimates |
PTC 2010 vs. 2009 Estimates Variation |
|
Local |
|
|
|
|
Simple Tandem |
|
|
|
|
Double Tandem |
|
|
|
|
Total |
|
|
|
[ECI] Figures in million minutes. Source: PTC.
The following table presents PTC estimates for time-base interconnection traffic volumes for 2010, as well as results for 2008 and 2009, and the corresponding variations, broken down into origination and termination services.
|
|
2008 |
2009 |
PTC 2010 Estimates |
2009 vs. 2008 Variation |
PTC 2010 vs. 2009 Estimates Variation |
|
Origination |
|
|
|
|
|
|
Termination |
|
|
|
|
|
|
Total |
|
|
|
|
|
[ECI] Figures in million minutes. Source: PTC.
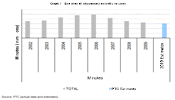
In regards to 2009 results, PTC’s estimates for 2010 present an approximately 7% decrease in origination traffic, and an approximately 3% reduction in termination traffic, which should result in an approximately 4% decrease in global interconnection traffic.
The following graph shows the evolution of traffic volumes in the 2002-2009 period, including PTC’s estimates for 2010.
Graph 1 – Evolution of interconnection traffic volumes
ICP-ANACOM’s forward year-on-year analysis on traffic volumes for 2010 produced a more intense traffic decrease than the one foreseen by PTC. Considering that PTC has access to more detailed information on the evolution of traffic over its network, as well as on traffic distribution according to the several levels and time periods defined in the tariff scheme, ICP - ANACOM accepts PTC’s estimates for 2010 for interconnection traffic volumes and the traffic profile estimated for average call duration and traffic distribution according to the several interconnection levels and periods, as the respective figures are deemed to adequately represent a scenery of interconnection service evolution. It is also assumed that, in the lack of a better approximation, call duration follows a negative exponential distribution.
It should also be noted that the estimates used in the analysis take into account the traffic originated from virtual cards and traffic to other operators’ non-geographical services. Moreover, within the RIO, the tariffs that apply to call origination in the above-mentioned situations are the same, and thus it is appropriate to use overall volumes to estimate origination volumes for 2010.


