Four graphs in the annex demonstrate results of the study of standard price evolution between 1998 and 2003. The graphs are arranged as follows:
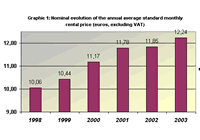
Graphic 1: Nominal evolution of the average annual price of monthly rental
(Click on the image to see the graphic in a new window)
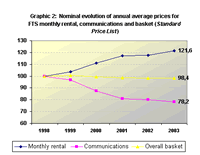
Graphic 2: Nominal evolution of the annual average prices for FTS monthly rental, communications and basket
(Click on the image to see the graphic in a new window)
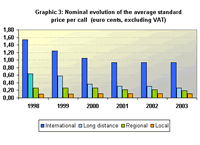
Graphic 3: Nominal evolution of the average price per call
(Click on the image to see the graphic in a new window)
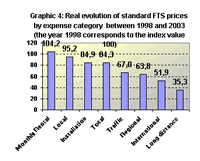
Graphic 4: Real evolution of FTS prices by expense category
(Click on the image to see the graphic in a new window)


