Following is a brief synthesis of results of this study.
| 1998 | 1999 | 2000 | 2001 | 2002 | 2003 | |
|---|---|---|---|---|---|---|
| Installation | 100,0 | 99,0 | 99,0 | 99,0 | 99,0 | 99,0 |
| Monthly Rental | 100,0 | 103,7 | 111,0 | 117,1 | 117,7 | 121,6 |
| Local | 100,0 | 106,5 | 109,2 | 109,2 | 109,2 | 111,1 |
| Regional | 100,0 | 102,4 | 100,6 | 83,8 | 82,0 | 74,4 |
| Long Distance | 100,0 | 90,3 | 56,3 | 48,3 | 47,4 | 41,2 |
| International | 100,0 | 80,2 | 67,7 | 60,7 | 60,6 | 60,6 |
| Traffic | 100,0 | 96,7 | 87,3 | 80,8 | 80,3 | 78,2 |
| Total | 100,0 | 100,5 | 99,4 | 98,5 | 98,5 | 98,4 |
1998 (Base year)=100
Table 1 indicates that the nominal value of the installation price remained practically unchanged throughout the study period, as its price was only reduced in February 1998.
The prices of international calls to fixed networks have also been constant since July 2001, countering the accentuated drop they had experienced until that date.
The nominal price of the FTS basket has been practically constant since 2000; this is explained by the differentiated evolution of the price table?s various components.
Study of these results also shows that with respect to the study published for the 1998-2001 period, and although individually considered provisions maintained their respective courses, the overall FTS basket has had less accentuated reductions. This result is due to the increased weight of the fixed provisions in the basket, particularly the weight of monthly rental (whose price has been increasing) in detriment to the weight of communications. Reduction of the weight for communications specifically and simultaneously derives from the lower consumption of telephone calls and the lower price of medium and long distance calls.
| 1998-20011https://www.anacom.pt/render.jsp?contentId=55129 | 1998-2003 | |
|---|---|---|
| Installation | -0,3% | -0,2% |
| Monthly Rental | 5,4% | 4,0% |
| Local | 3,1% | 2,1% |
| Regional | -5,6% | -5,7% |
| Long Distance | -21,5% | -16,2% |
| International | -15,8% | -9,5% |
| Traffic | -7,0% | -4,8% |
| Total | -3,4% | -0,3% |
Table 2 shows that the local call price and the monthly rental price have in nominal terms evidenced a rising tendency (although less accentuated for local calls), with annual average nominal increases of 2.1% and 4.0% respectively.
The average annual price of regional and long distance calls dropped with regard to the base year, by 5.7% and 16.2% respectively (5.6% and 21.5% in the 1998-2001 period).
Note also that there was an average annual nominal drop of 9.5% (15.8% until 2001) in the international traffic price.
The annual average decrease in nominal FTS prices was at 3.0%.
The evolution of FTS prices shown in tables 1 and 2 may be associated to some of the following aspects:
- From 1999 on, the mobile operators had alternative means to transport international traffic originating in their networks, increasing the competitiveness of international calls made from those networks, with consequences for the prices practised by Portugal?s historic operator for international calls originating in the fixed network;
- Indirect access to switched, national and international services of operators and providers that are interconnected were liberalised from 1 January 2000, by means of their call-to-call selection, with the pre-selection function provided from July of that year;
- The beginning of 2001 witnessed the opening of indirect access for local and regional communications;
- At the end of the 1st quarter of 2003 the alternative operators had attained a market share of 10.2% of traffic, with their strategy essentially based on service provision in the indirect access mode.
| 1998-20011https://www.anacom.pt/render.jsp?contentId=55129 | 1998-2003 | |
|---|---|---|
| Installation | -9,9% | -15,1% |
| Monthly Rental | 6,5% | 4,2% |
| Local | -0,4% | -4,8% |
| Regional | -23,4% | -36,2% |
| Long Distance | -55,9% | -64,7% |
| International | -45,8% | -48,1% |
| Traffic | -26,8% | -33,0% |
| Total | -17,9% | -15,7% |
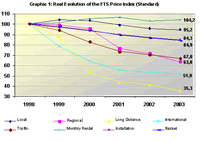
In real terms, most prices of the various FTS invoice components dropped notably; this is even more evident in international traffic and long distance traffic. Monthly rental is the only provision in which a real increase of prices (+4.2%) is identified.
Graphic 1: Real Evolution of the Fixed Telephone Service Price Index (Standard)
(Click on the image to see the graphic in a new window)
-----
1With the profiles and weights applicable to the 98/01 period.


