Methodology
Fundamentals
This study?s methodology is based on 3 fundamental aspects:
a) End-to-end measurements: The measurements are made between a mobile network terminal point and a fixed network terminal point;
b) Impartiality: The measurements are made simultaneously, in time and space, for the three operators (OPTIMUS, VODAFONE and TMN), thus guaranteeing equality of testing conditions;
c) Objectivity: The tests are carried out in a totally automatic way, eliminating the subjectivity inherent to human intervention or decision.
Quality of Service Indicators
This survey analyzes three mobile network indicators of basic importance, considering quality from the user?s standpoint:
a) Coverage: Checking of the signal levels.
The testing and measurement equipment that was used measures the level of signal received by the mobile terminal. All these measurements are geo-referenced and then described on a map, thereby making it easy to view the coverage levels of each operator on the several studied routes.
| Signal Level (dBm) | |
|---|---|
| > -100 | Coverage |
| > -110 ^ <= -100 | Poor Coverage |
| <= -110 | No Coverage |
b) Accessibility: Checks a mobile network?s ability to establish and maintain calls.
It analyses the ability to successfully establish voice communications between two ends, a mobile network terminal and a fixed network terminal, and the ability of networks to maintain this call during a pre-established time length.
Whenever it was not possible to establish communication or when communication was dropped during the conversational phase, the cause for this failure or drop is identified.
c) Audio Quality: It monitors how conversations are perceived, by means of establishing a successful connection during a certain time length.
To evaluate this indicator, the system simulates a telephone conversation between two users.
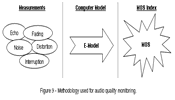
The method to evaluate audio quality, such as sensed by users, is based on the "E-Model" model, which is recommended by international organizations such as ETSI1https://www.anacom.pt/render.jsp?contentId=55129 (ETR 250) and ITU2https://www.anacom.pt/render.jsp?contentId=55130 (ITU-T Recommendation G.107). The MOS (Mean Opinion Score) index?s reckoning is based on this model.
Figure 9 - Methodology used for audio quality monitoring.

(Click here to see the full-size image)
The MOS scale quantifies the effort that it takes to understand a conversation. Its value is 0 when there is no communication and 5 when the communication is perfect. Values 0 and 5 are only theoretical and are therefore always absent in the measurement results.
MOS
Quality
5
Excellent
4
Good
3
Acceptable
2
Poor
1
Bad
Measurement Procedures
The tests are indeed the establishment and maintenance of voice calls under the following conditions:
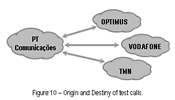
1. Between GSM Mobile Network terminals and a Fixed Telephone Network terminal (Mobile-Fixed);
Figure 10 - Origin and Destiny of test calls.

(Click here to see the full-size image)
2. During the collection of measurements, mobile terminal equipment (1 per operator) move along the studied route;
3. Calls are made in alternation from mobile and fixed terminals;
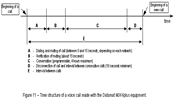
4. The time gap between consecutive calls is 160 seconds;
Figure 11 - Time structure of a voice call made with the Datamat M366plus equipment.

(Click here to see the full-size image)
5. After the successful establishment of a call, a conversational phase (a real conversation is simulated) takes place during up to 110 seconds3https://www.anacom.pt/render.jsp?contentId=55131 (lower if the call was dropped or the dialing time too long);
6. During the conversational phase, audio quality measurements (MOS) are made in each of the ends of the call.
Tested Areas
The main urban agglomerations of these archipelagos were analyzed - Ponta Delgada, Angra do Heroísmo and Funchal ? as well as the main road axels of all the islands.
Sample Size
Total Total Total Azores and Madeira
Hours in Measurements
Azores and Madeira
Azores
Angra do Heroísmo
6h11
Ponta Delgada
6h01
Corvo Island
1h05
Faial Island
6h04
Flores Island
3h50
Graciosa Island
3h08
Pico Island
6h30
Santa Maria Island
3h16
S. Jorge Island
6h11
S. Miguel Island
13h45
Terceira Island
6h33
62h34
Madeira
Funchal
6h14
Madeira Island
12h08
Porto Santo Island
3h05
21h27
84h01
Data Collection Conditions
Two measurement sessions with an approximate length of 3h00 each were held in each urban agglomeration.
The measurement sessions took place during normal working periods on weekdays.
Test and Measurement Equipment
For the conduction of these tests, ANACOM used the DATAMAT M366plus testing and measurement equipment, a Quality of Service analyzer for GSM networks.
Post-Processing Tools
There is a software tool named ?Report? that is associated to the M366plus equipment, which stores, organizes and generates statistics from the information previously collected by the measurement units.
The M366plus equipment includes a GPS receiver that enables geo-referencing for all measurements made. This information is handled by the ?GeoReport? tool which, in parallel with a third tool - ?MAPINFO? ? enables viewing of the statistical information generated by ?REPORT?, on digital geographical charts.
-----
1 European Telecommunications Standards Institute.
2 International Telecommunications Union.
3 Value close to the average conversation time of communications using the analyzed networks in the 1st quarter of 2005


