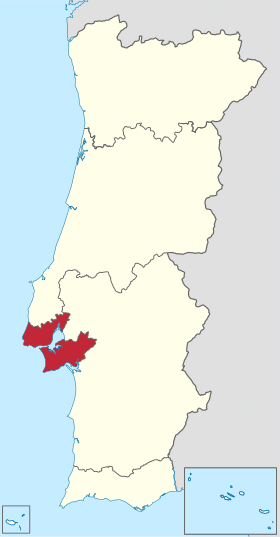
ANACOM carried out a study to assess the performance of mobile voice and data services and GSM (2G), UMTS (3G) and LTE (4G) coverage provided by MEO, NOS and Vodafone in the Lisbon Metropolitan Area, which covers 18 municipalities1 and has an area of around 3,000 km2, which is 3% of the surface area of the country (see Figure 1). This is the third study published this year. The previous studies covered the Alentejo and North regions.
Figure 1 – NUTS II Lisbon Metropolitan Area
These studies aim to provide the market with impartial information on the performance of these services, and characterise the user experience in terms of accessibility, retention and integrity of the services. For this purpose, the following were performed by ANACOM: (i) calls and conversations, to assess voice service; (ii) downloads of files, web pages and videos, to assess data services; (iii) measurements of radio network signal levels, to assess coverage; resulting in 13 quality indicators used to measure service performance and radio coverage (see Annex 1).
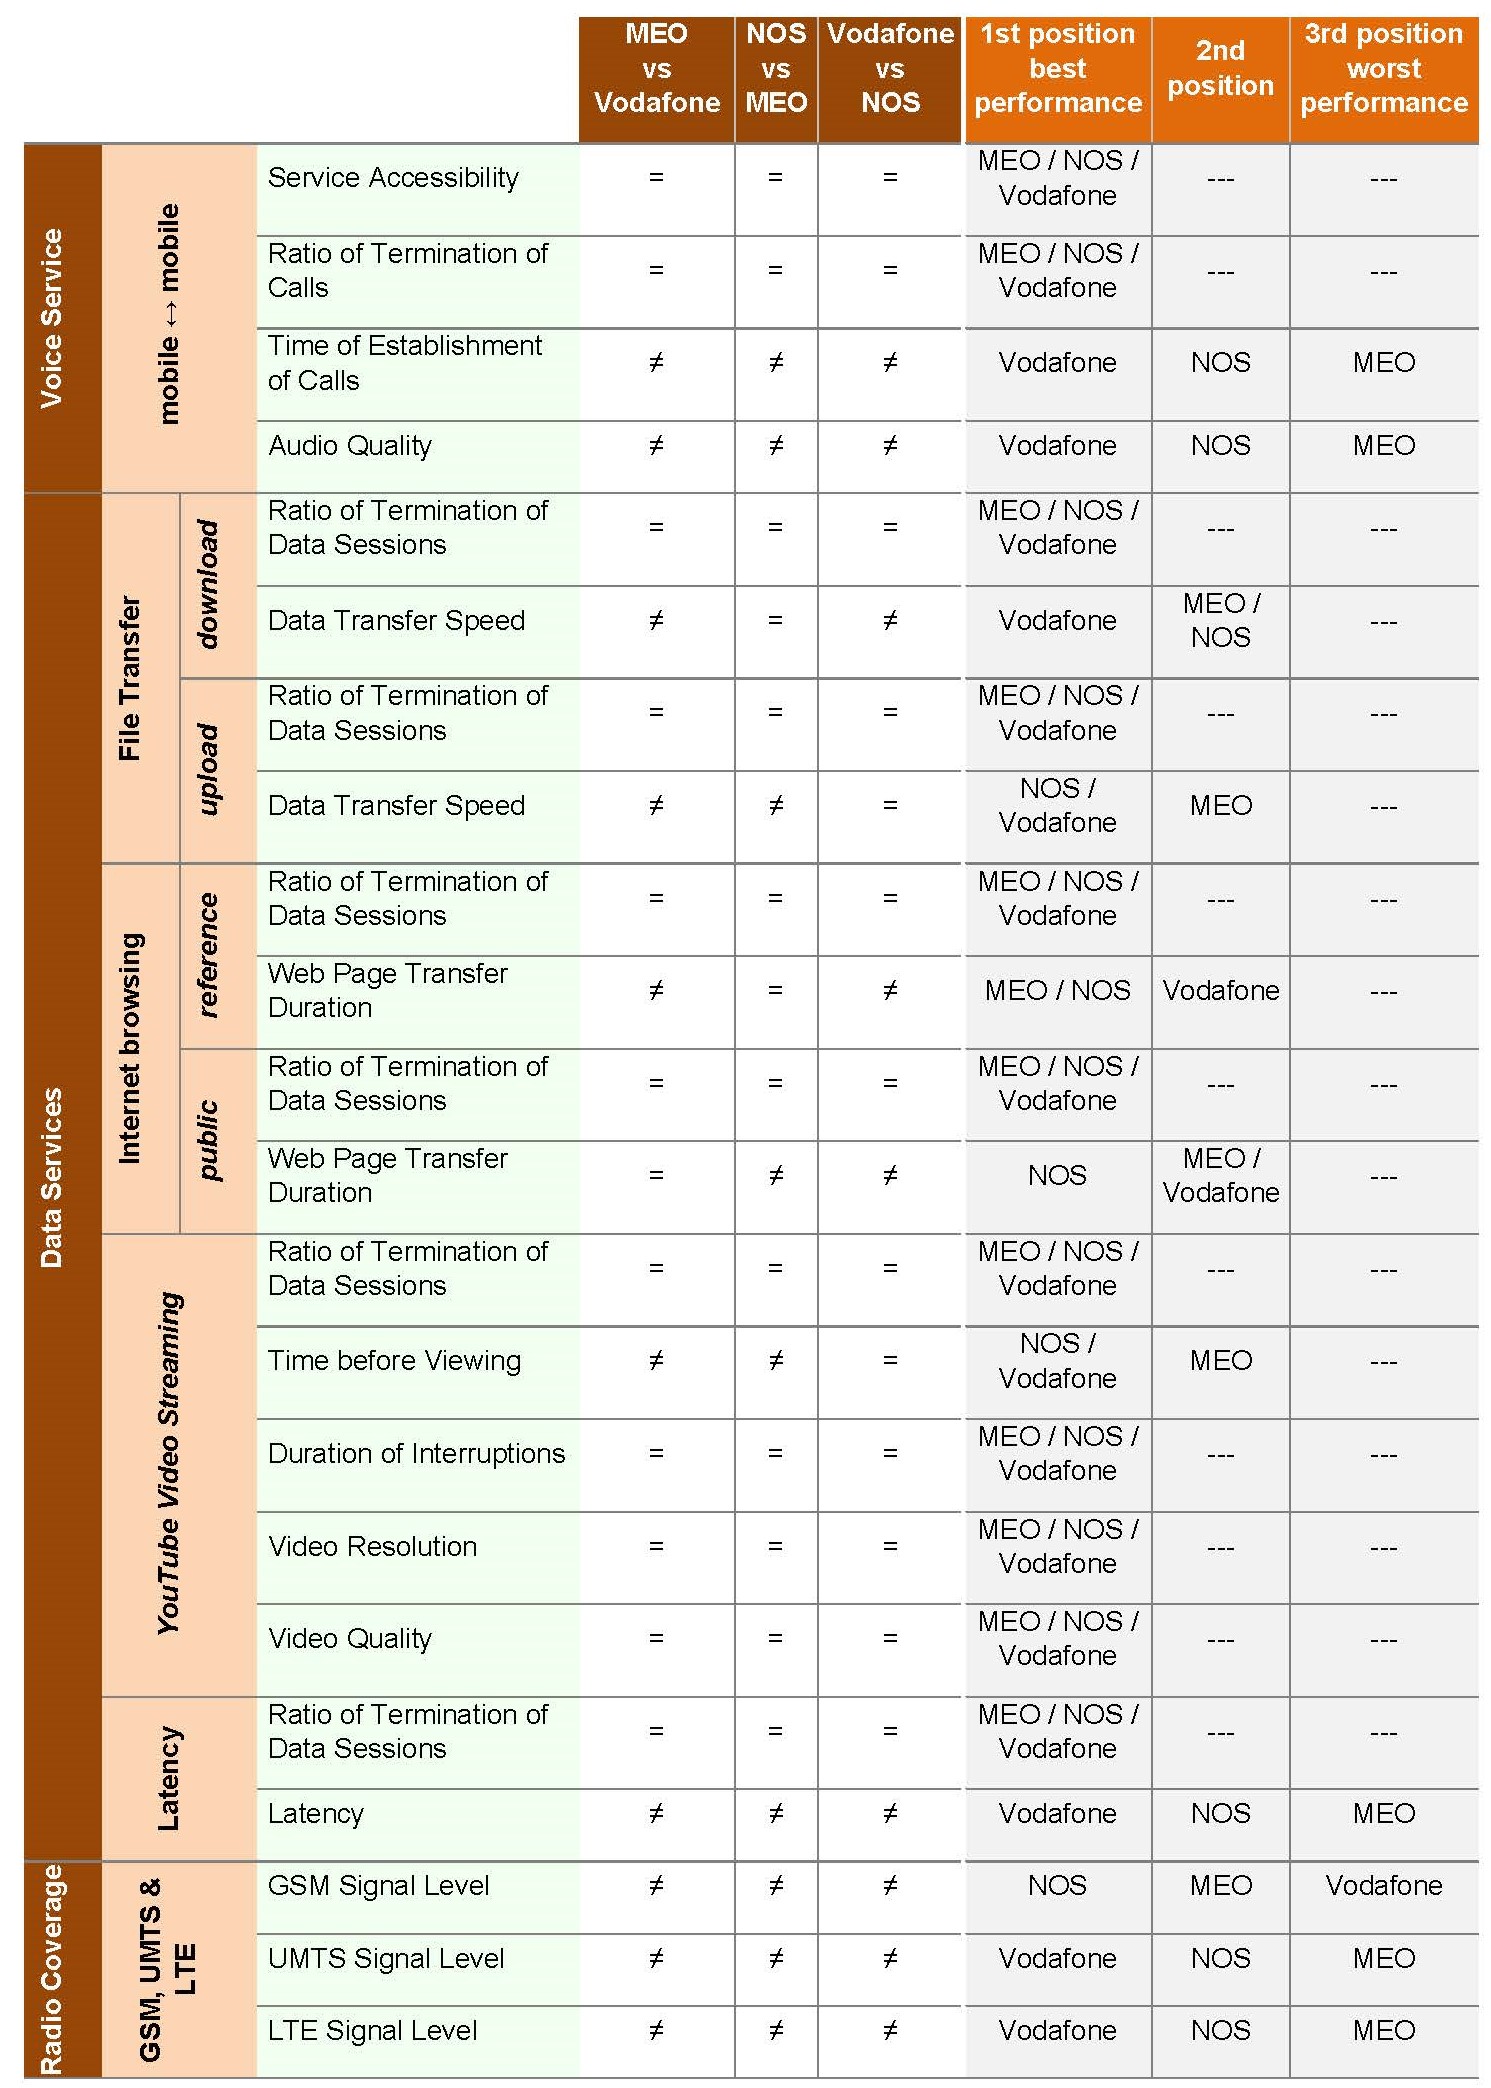
The study on the Lisbon Metropolitan Area shows that the radio coverage by the operators analysed showed good overall performance. GSM (2G) recorded the highest performance levels, with little difference between the operators; however, for UMTS (3G) and LTE (4G), lower performance levels were observed and the differences between operators were more significant, with Vodafone having the best performance (see Annex 2).
The voice service had good overall performance and no differences were observed between operators in terms of capacity to establish and retain calls. In relation to conversation integrity and the average time needed to establish a call, differences were recorded between operators, but these are of little relevance from the point of view of users.
Data services showed good overall performance and no differences were observed between operators in terms of capacity to establish and retain data sessions in all the services analysed. File transfers recorded good average data transfer rates for downloads and uploads, with some performance differences between operators. There was also a very high degree of variability in this indicator, with maximum rates of around 153 Mbps and 62 Mbps and minimum rates of 0.2 Mbps and 0.7 Mbps, respectively, for downloads and uploads.
The Internet browsing services recorded reasonable average transfer times for web pages, both reference and public, with little difference between operators.
In turn, the YouTube video streaming service recorded good performance with little difference between operators.
Data transmission latency recorded adequate levels, albeit with some variability, and slight differences were observed between operators.
This study is based on tests carried out according to the new methodology approved by ANACOM in 2017 following market consultation. Measurements are taken systematically, using standard procedures and without human intervention or decision and under the same conditions for the different operators, thus allowing for an objective and comparative analysis of performances. In the sampling approach followed, the universe is taken to be the set of mobile communications made in mainland Portugal, with mobile voice calls and mobile data sessions being the statistical units considered. The sample is based on two stratification levels. The first separates mainland Portugal into NUTS II, followed by a breakdown by NUTS III. The study now published refers to the results obtained from the sample from the Lisbon Metropolitan Area (NUTS II).
The fieldwork for this third study took place between 25 May and 6 June 2020. 972 voice calls, 6550 data sessions and 589,937 radio signal measurements were carried out, corresponding to approximately 324 voice calls, 364 data sessions and 65,549 radio signal measurements, by indicator and by operator. 285 kilometres were travelled during testing.
It should be noted that when reading the results, it is important to remember the dynamic nature and constant evolution of mobile communications.
ANACOM expects to continue with studies for the remaining regions in mainland Portugal this year. These will be followed by the studies on the Autonomous Regions of the Azores and Madeira.
Annex 1
Quality indicators used to measure service performance and radio coverage
1. Radio Coverage – availability of GSM, UMTS and LTE radio infrastructures;
2. Accessibility of the Voice Service – probability of success in establishing calls;
3. Ratio of Termination of Voice Calls – probability of a call, after being successfully established, continuing active during a period of time and terminating normally, in other words, as intended by the user;
4. Time of Establishment of Voice Calls – period of time the network takes to establish the communication after the request has been sent correctly (destination telephone number);
5. Audio Quality – perceptibility of the conversation during a voice call;
6. Ratio of Termination of Data Sessions – probability of a service use session – file transfer, Internet browsing or YouTube video streaming – being established and continuing successfully, in order words, remaining active during the entire period predefined for the file transfer, allowing the entire web page to be transferred or the complete reproduction of multimedia content;
7. Data Transfer Speed – quantifies the average speed of data transfer during a file transfer session;
8. Web Page Transfer Duration – quantifies the average time needed to transfer a web page;
9. Time before Viewing Content – period of time between the request for multimedia content and when the first image of that content is viewed on the user's terminal equipment during a YouTube video streaming session;
10. Duration of Interruptions – the total of all interruptions or freezing occurring during a YouTube video streaming session;
11. Video Streaming – quantifies the visual quality of the communication during a YouTube video streaming session;
12. Video Resolution – quantifies the average number of image pixels while playing a video during a YouTube video streaming session;
13. Data Transmission Latency – quantifies the time needed for an information package to travel from the user's equipment to the Content Server or vice-versa.
Annex 2
Summary of the differences between operators

1 Alcochete, Almada, Amadora, Barreiro, Cascais, Lisbon, Loures, Mafra, Moita, Montijo, Odivelas, Oeiras, Palmela, Seixal, Sesimbra, Setúbal, Sintra and Vila Franca de Xira.
Consult:
- Performance evaluation of mobile services and GSM, UMTS and LTE coverage in the Lisbon Metropolitan Area (NUTS II) https://www.anacom.pt/render.jsp?contentId=1604103


