The final CLSU value for 20141 for the period before the tender designation of an USP is 7,721,671 Euro, according to AXON’s audit report to CLSU estimates presented by MEO, a value which reflects the implementation of recommendations made by auditors to values submitted initially by MEO as well as consideration of recast CAS values for 2014, which were approved by ANACOM on 25.05.2016.
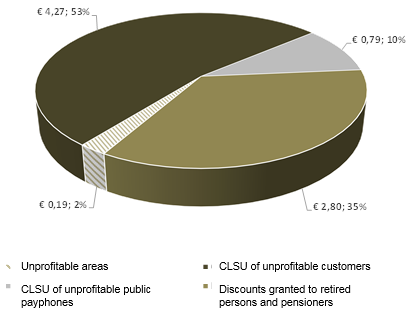
In terms of relevance of each component in the value of net costs (difference between avoidable costs and lost revenue) a distribution similar to the one verified in the preceding year is maintained. The component of unprofitable customers in profitable areas continues to show a higher proportion (53%2), followed by the component of retired persons and pensioners, which represents 35% of total net costs, just like in the preceding year. The two remaining components maintain their relative weight: the public payphone component shows a weight by 10%3 and the component associated to unprofitable areas remains as the one with the lowest relevance - around 2%4.
The following chart illustrates the values of net costs and the weight of each component.
Chart 1 - Net costs prior to the consideration of indirect benefits, per component, for 2014*

Source: MEO and ANACOM calculations. Values in percentage and million Euro.
* FTS between 1 January and 31 May 2014 and PPP between 1 January and 8 April 2014.
In 2014, the value calculated for the component of unprofitable customers in profitable areas amounts to 4,272,532 Euro. Although it is not possible to compare directly this value with the one obtained for 2013, given that the period of US provision is different, it appears that the number of unprofitable customers in profitable areas has decreased. In 2013 there were 112,619 unprofitable customers in profitable areas and, in 2014, notwithstanding the increase of profitable areas - two more, there is a total of 86,890 unprofitable customers in profitable areas.
The value of net costs associated to the component of retired persons and pensioners corresponds to 2,796,308 Euro and to 98,168 retired persons and pensioners, around less 10% than the number of retired persons and pensioners in 2013 (108,540 retired persons and pensioners).
The third most representative component is public payphones, the value of which amounts to 788,751 Euro, whereby the proportion of unprofitable public payphones in profitable areas, compared to the total of public payphones, slightly increased between 2013 and 2014, although the number of unprofitable public payphones in 2014 decreased compared to the preceding year.
Lastly, the component with the least relevance in the value of net costs before indirect benefits are taken into consideration is the unprofitable areas component, which amounted in 2014 to 190,716 Euro, in a total of 29 unprofitable areas, less two than those in 2013.
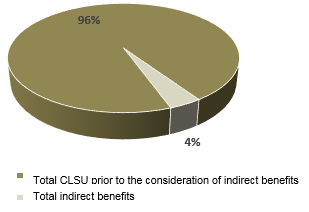
As regards the relevance of indirect benefits in the total amount of costs, that is, in the establishment of the value of CLSU, their weight has slightly decreased; in 2014 it represents 4% compared to the 5% verified in the preceding year. The following chart illustrates the weight of indirect benefits in the total of CLSU prior to the consideration of indirect benefits.
Chart 2 - Weight of indirect benefits in the total of CLSU prior to the consideration of indirect benefits

Source: MEO and ANACOM calculations.
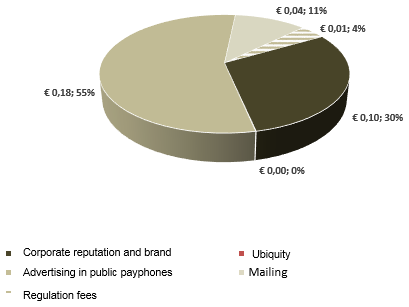
In 2014, the value calculated for indirect benefits amounts to 326,636 Euro, whereby the largest indirect benefit continues to be the one associated with “advertising in public payphones”, with a weight of 55%, which is however less representative than in 2013 (61%). Just like in 2013, the second most relevant indirect benefit is “corporate reputation and brand enhancement”, with a weight of 30% compared to 27% in the preceding year.
The “mailing”, “regulation fees” and “ubiquity” indirect benefits maintain a level of representativeness close to that in the preceding year. Mailing is the third most relevant benefit, with a weight around 11%5, followed by the benefit associated to regulation fees, with a representativeness of 4%6, and by the ubiquity indirect benefit with a weight by less that 1%, just like the preceding year.
Chart 3 - Final values for indirect benefits, per type of benefit, for 2014*

Source: MEO and ANACOM calculations. Values in million Euro.
* FTS between 1 January and 31 May 2014 and PPP between 1 January and 8 April 2014
1 Reference to 2014 CLSU must be regarded, in this context, as CLSU incurred by MEO between 1 January 2014 and 31 May 2014 for the provision of FTS and between 1 January and 8 April for the provision of PPP.
2 In 2013, this component represented 49% of CLSU prior to the consideration of indirect benefits.
3 In 2013, this component represented 14% of CLSU prior to the consideration of indirect benefits.
4 In 2013, this component represented 3% of CLSU prior to the consideration of indirect benefits.
5 In 2013, this component represented 9% of indirect benefits.
6 In 2013, this component represented 3% of indirect benefits.


